For 2016 details - East of Sussex Property Market 2016
Story Highlights
- East of Sussex had total property sales of £3.25 billions in 2015
- Total Sales at district level was maximum for Wealden at £1.01 billions
- The total number of properties sold in 2015 was 11,902 properties
- The average sales price in East of Sussex was £273 K
- The average sales price at District level was maximum for Wealden £330 K
- New Property sales were 4.76% by value, where as Not New 95.24%
East of Sussex is one of the counties of South East England. The districts of East of Sussex are Wealden, Rother, Lewes, Eastbourne, Hastings.
Total Sales By Districts
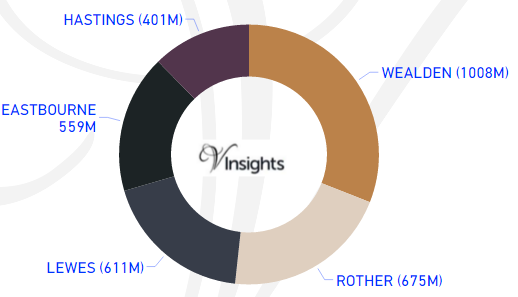
East of Sussex had total property sales of £3.25 Billions which was 5.31% of the total South East property Market in 2015.
The split of the sales across the different districts was:
- Wealden £1.01 billions (30.98%)
- Rother £675 millions (20.74%)
- Lewes £611 millions (18.77%)
- Eastbourne £559 millions (17.2%)
- Hastings £401 millions (12.32%)
Total Sales By Property Type
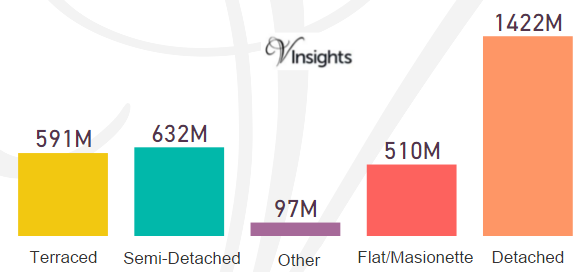
The split of £3.25 Billions across the different property types are:
- Detached £1.42 billions (43.72%)
- Terraced £591 millions (18.18%)
- Semi-Detached £632 millions (19.44 %)
- Flat/Maisonette £510 millions (15.67%)
- Other 97 millions (2.99%)
Total No Of Properties Sold By Property Type
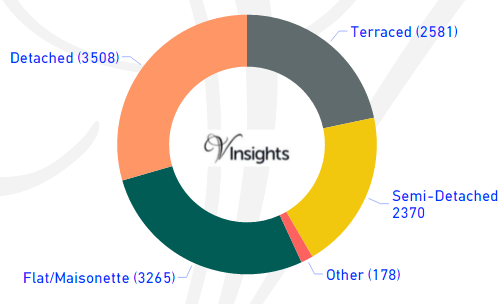
The total property sales of £3.25 Billions in 2015 was spread over 11,902 properties.
- Terraced properties was 2,581 (21.69%)
- Detached 3,508 (29.47%)
- Semi-Detached 2,370 ( 19.91%)
- Flat/Maisonette 3,265 (27.43%)
- Others 178 (1.5%)
Average & Median Sales Price
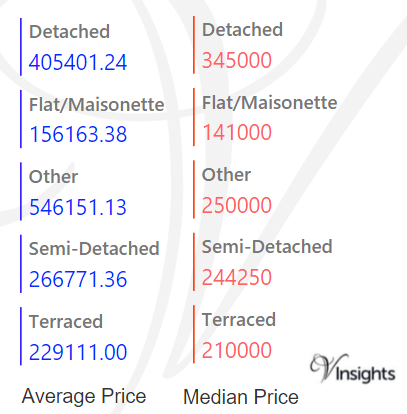
The average sales price in East of Sussex was £273 K and for the different property types it was:
- Detached £405 K
- Semi-Detached £267 K
- Terraced £229 K
- Flat/Maisonette £156 K
- Other it was £546 K
Similarly median sales price in East of Sussex was £235 K and for the different property types was:
- Detached £345 K
- Semi-Detached £244 K
- Terraced £210 K
- Flat/Maisonette £141 K
- Other it is £250 k
Average & Median Sales Price By Districts
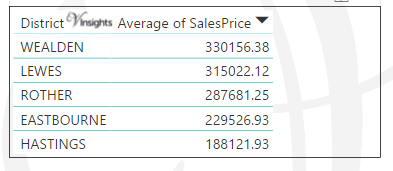
The average sales price at district level in East of Sussex in 2015 is as above.
- The maximum average sales price in East of Sussex was for Wealden £330 K
- Lewes £315 K
- Rother £288 K
- Eastbourne £230 K
- Minimum was for Hastings £188 K
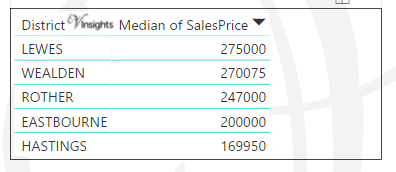
The median sales price at district level in East of Sussex in 2015 is as above.
- The maximum median sales price in East of Sussex was for Lewes £275 K
- Wealden £270 K
- Rother £247 K
- Eastbourne £200 K
- Hastings £170 K
New Vs Not New Property Statistics
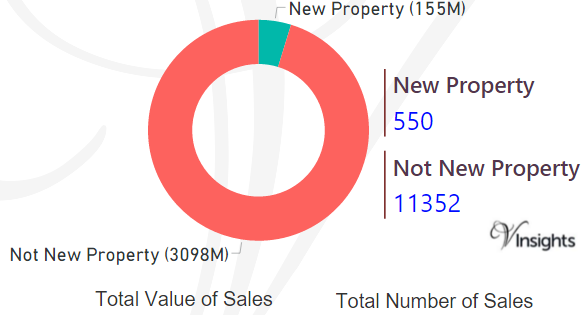
By Sales Values the split is as follows:
- New Property contributed £155 millions (4.76%)
- Not New Property contributed £3.1 billions (95.24 %)
By Total Number the split is as follows:
- New properties sold were 550 (4.62%)
- Not new property sold were 11,352 (95.38%)
All East of Sussex Posts

ab9a49d0-df4c-48f8-9b5a-d3a7f76d200a|0|.0|27604f05-86ad-47ef-9e05-950bb762570c

For 2016 details - Buckinghamshire Property Market 2016
Story Highlights
- Buckinghamshire had total property sales of £4.55 Billions in 2015
- The total number of properties sold in 2015 was 10,128 properties
- The average sales price in Buckinghamshire was £449 K, whereas median was £325 K
- Across its districts average sales price in Buckinghamshire was maximum for South Bucks £680 K
- New Property sales were 9.64% by value, where as Not New Property contributed 90.36%
Buckinghamshire is one of the counties of South East England. The districts of Buckinghamshire are Aylesbury Vale, Wycombe, Chiltern, South Bucks. Let us look at the Buckinghamshire Property Market for 2015 in detail.
Total Sales By Districts
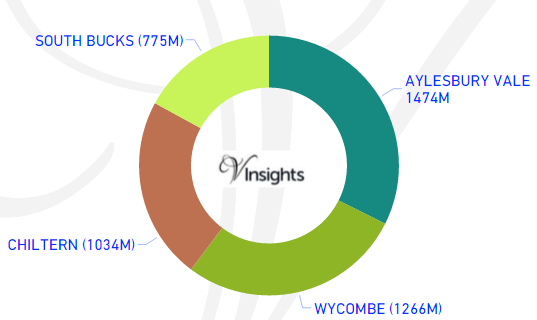
Buckinghamshire had total property sales of £4.55 Billions which was 7.43% of the total South East property Market in 2015.
The split of the sales across the different districts was:
- Aylesbury Vale £1.5 billions (32.4%)
- Wycombe £1.27 billions (27.82%)
- Chiltern £1.03 billions (22.74%)
- South Bucks £775 millions (17.04%)
Total Sales By Property Type
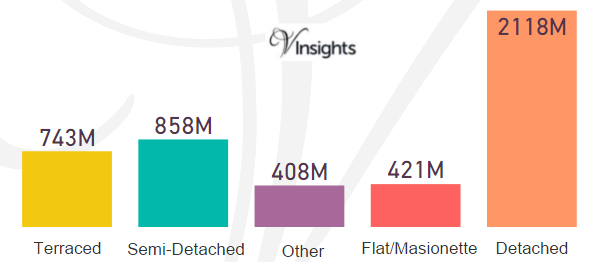
The split of £4.55 Billions in Buckinghamshire across the different property types are:
- Terraced £743 millions (16.33%)
- Semi-Detached £858 millions (18.87%)
- Other £408 millions (8.97%)
- Flat/Maisonette £421 millions (15.28%)
- Detached £2.12 billions (46.57%)
Total No Of Properties Sold By Property Type
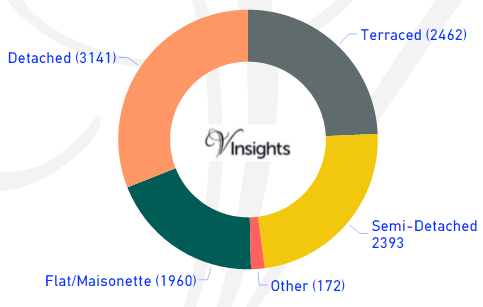
Buckinghamshire had total property sales of 10,128. The split across different property types are:
- Detached 3141 (31.01%)
- Flat/Maisonette 1960 (19.35%)
- Other 172 (1.7%)
- Semi-Detached 2393 (23.63%)
- Terraced 2462 (24.31%)
Average & Median Sales Price
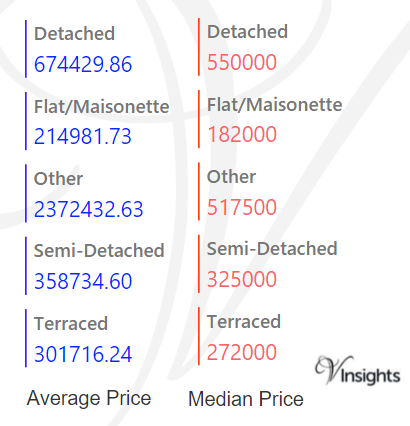
The average sales price in Buckinghamshire was £449 K and for different property types it was:
- Detached £674 K
- Semi-Detached £359 K
- Terraced £302 K
- Flat/Maisonette £215 K
- Other it is £2.37 millions
Similarly median sales price in Buckinghamshire was £325 K and for different property types are:
- Detached £550 K
- Semi-Detached £325 K
- Terraced £272 K
- Flat/Maisonette £182 K
- Other it is £518 K
Average & Median Sales Price By Districts
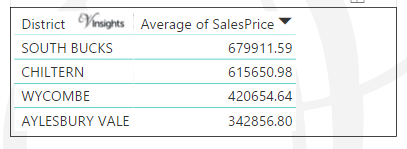
Across districts the average sales price is as above.
- South Bucks £680 K
- Chiltern £616 K
- Wycombe £421 K
- Aylesbury Vale £343 K
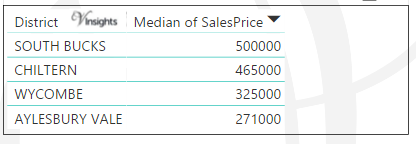
Across districts the median sales price is as above.
- South Bucks £500 K
- Chiltern £465 K
- Wycombe £325 K
- Aylesbury Vale £271 K
New Vs Not New Property Statistics
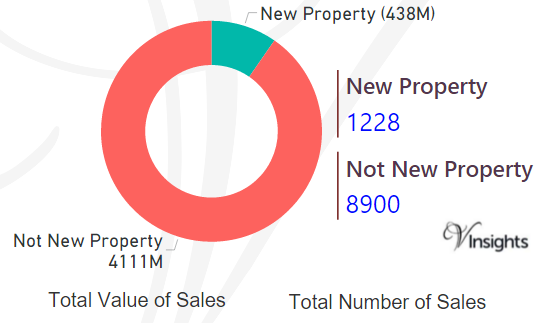
By Sales Value the split is as follows:
- New Property contributed £438 millions (9.64%)
- Not New Property contributed £4.11 billions (90.36 %)
By Total Number the split is as follows:
- New properties sold were 1,228 (12.12%)
- Not new property sold were 8,900(87.88%)
All Buckinghamshire Posts

700088cf-db2d-40b2-98bc-d929dff859c6|0|.0|27604f05-86ad-47ef-9e05-950bb762570c
For 2016 details - Brighton And Hove Property Market 2016
Story Highlights
- Brighton And Hove had total property sales of £2.078 Billions in 2015
- The total number of properties sold in 2015 was 5,695 properties
- The average sales price in Brighton And Hove was £365 K, whereas median was £300 K
- New Property sales were 4.84% by value, where as Not New Property contributed 95.16%
Brighton and Hove is an unitary authority area in South East England.
Total Sales By Property Type
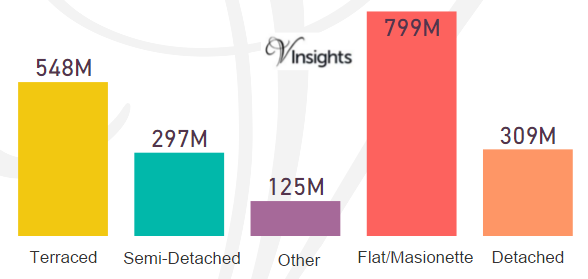
Brighton and Hove had total property sales of £2.078 Billions which was 3.39% of the total South East property Market in 2015.
The split across the different property types in Brighton And Hove are:
- Terraced £548 millions (26.37%)
- Semi-Detached £297 millions (14.29%)
- Other £125 millions (6.01%)
- Flat/Maisonette £799 millions (38.46%)
- Detached £309 millions (14.86%)
Total No Of Properties Sold By Property Type
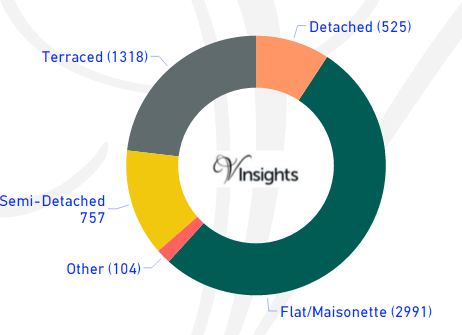
Brighton And Hove had total property sales of 5,695. The split across the different property types are:
- Detached 525 (9.22%)
- Flat/Maisonette 2991 (52.52%)
- Other 104 (1.83%)
- Semi-Detached 757 (13.29%)
- Terraced 1318 (23.14%)
Average & Median Sales Price
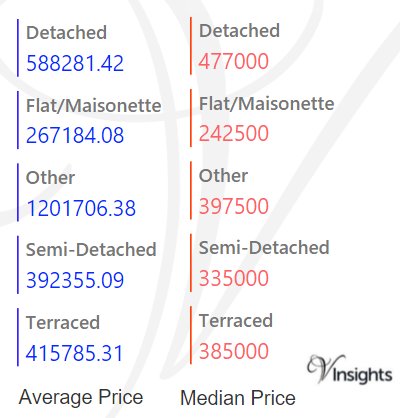
The average sales price in Brighton And Hove was £365 K and for different property types it was:
- Detached £588 K
- Semi-Detached £392 K
- Terraced £416 K
- Flat/Maisonette £267 K
- Other it is £1.2 millions
Similarly median sales price in Brighton And Hove was £300 K and for different property types are:
- Detached £477 K
- Semi-Detached £335 K
- Terraced £385 K
- Flat/Maisonette £243 K
- Other it is £398 K
New Vs Not New Property Statistics
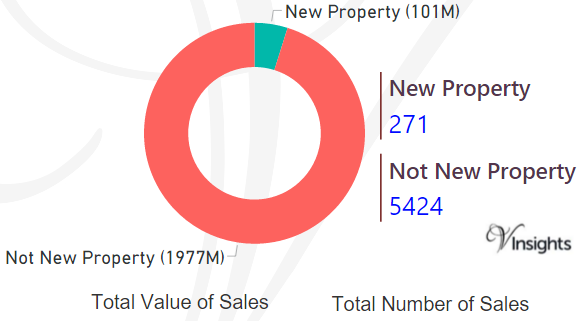
By Sales Values the split is as follows:
- New Property contributed £101 millions (4.84%)
- Not New Property contributed £1.98 billions (95.16%)
By Total Number the split is as follows:
- New properties sold were 271 (4.76%)
- Not new property sold were 5,424 (95.24%)
All England Posts

4c0b2942-7ee6-4226-b104-afa4d31e8357|0|.0|27604f05-86ad-47ef-9e05-950bb762570c
For 2016 details - Berkshire Property Market 2016
Story Highlights
- Berkshire had total property sales of £6.74 Billions in 2015
- Across the districts maximum sales was in Wokingham at £1.46 billions
- The total number of properties sold in 2015 was 16,311 properties
- The average sales price in Berkshire was £413 K, whereas median was £307 K
- Across its districts average sales price was maximum for Windsor And Maidenhead at £550 K
- New Property sales were 12.25% by value, where as Not New Property contributed 87.75 %
Berkshire is one of the counties of South East England. The districts of Berkshire are Wokingham, Windsor And Maidenhead, Reading, West Berkshire, Bracknell Forest, Slough. Let us look at the Berkshire Property Market for 2015 in detail.
Total Sales By Districts
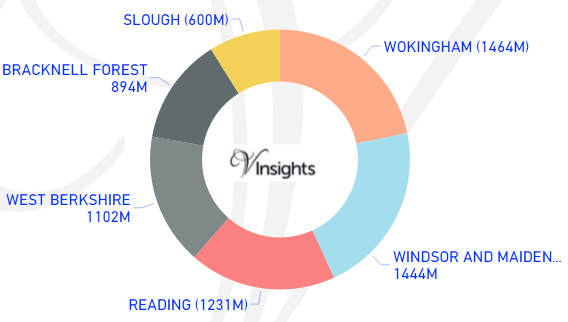
Berkshire had total property sales of £6.74 Billions which was 10.99% of the total South East property Market in 2015.
The split of the sales across the different districts was:
- Wokingham £1.5 billions (21.74%)
- Windsor And Maidenhead £1.44 billions (21.44%)
- Reading £1.2 billions (18.28%)
- West Berkshire £1.1 billions (16.36%)
- Bracknell Forest £894 millions (13.27%)
- Slough £600 millions (8.9%)
Total Sales By Property Type

The split across the different property types in Berkshire are:
- Terraced £1.42 billions (21.02%)
- Semi-Detached £1.22 billions (18.11%)
- Other £883 millions (13.11%)
- Flat/Maisonette £1.03 billions (15.28%)
- Detached £2.19 billions (32.47%)
Total No Of Properties Sold By Property Type

Berkshire had total property sales of 16,311. The split across the different property types are:
- Detached 3672 (22.51%)
- Flat/Maisonette 4458 (27.33%)
- Other 254 (1.56%)
- Semi-Detached 3307 (20.27%)
- Terraced 4620 (28.32%)
Average & Median Sales Price

The average sales price in Berkshire was £413 K and for the different property types it was:
- Detached £596 K
- Semi-Detached £369 K
- Terraced £307 K
- Flat/Maisonette £231 K
- Other it is £3.48 million
Similarly median sales price in Berkshire was £307 K and for different property types are:
- Detached £500 K
- Semi-Detached £345 K
- Terraced £278 K
- Flat/Maisonette £208 K
- Other it is £753 k
Average & Median Sales Price By Districts

Across districts the average sales price is as above.
- Windsor And Maidenhead £550 K
- Wokingham £468 K
- Bracknell Forest £390 K
- West Berkshire £384 K
- Reading £370 K
- Slough £291 K

Across districts the median sales price is as above.
- Windsor And Maidenhead £420 K
- Wokingham £376 K
- West Berkshire £295 K
- Bracknell Forest £290 K
- Reading £250 K
- Slough £250 K
New Vs Not New Property Statistics
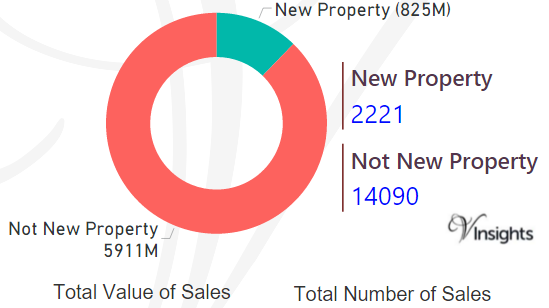
By Sales Values the split is as follows:
- New Property contributed £825 millions (12.25%)
- Not New Property contributed £5.9 billions (87.75%)
By Total Number the split is as follows:
- New properties sold were 2,221 (13.62%)
- Not new property sold were 14,090(86.38%)
All Berkshire Posts

5a8caff7-1c38-4862-88cb-dc544d792fd8|0|.0|27604f05-86ad-47ef-9e05-950bb762570c
Story Highlights
- Surrey had total property sales of £11.16 Billions in 2015
- The total number of properties sold in 2015 was 22,170.
- The average sales price in Surrey was £503.67 K, whereas median was £375 K
- Across its districts average sales price in Surrey was maximum for Elmbridge at £748 K and was minimum for Spelthrone £385 K
- Similarly the median sales price in Surrey was maximum for Elmbridge £501 K and was minimum for Woking £340 K
- New Property sales were 6.69% by value, where as Not New Property contributed 93.31%
Surrey is one of the counties of South East England. The districts of Surrey are Elmbridge, Reigate and Banstead, Guildford, Waverley, Working, Mole Valley, Tandridge, Runnymede, Surrey Heath, Spelthorne, Epsom and Ewell. Let us look at the Surrey Property Market in 2015 in detail.
Total Sales By Districts
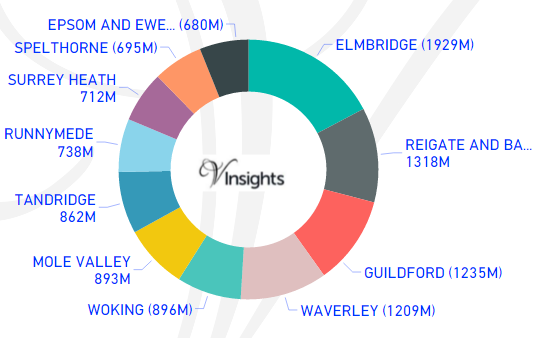
Surrey had total property sales of £11.16 Billions which was 18.23% of the total South East property Market in 2015.
The split of the sales across the different districts was:
- Elmbridge £1.93 billions (17.28%)
- Reigate and Banstead £1.32 billions (11.8%)
- Guildford £1.24 billions (11.06%)
- Waverley £1.21 billions (10.83%)
- Woking £896 millions (8.03%)
- Mole Valley £893 millions (7.99%)
- Tandridge £862 millions (7.72%)
- Runnymede £738 millions (6.61%)
- Surrey Heath £712 millions (6.37%)
- Spelthorne £695 millions (6.22%)
- Epsom and Ewell £680 millions (6.09%)
Total Sales By Property Type
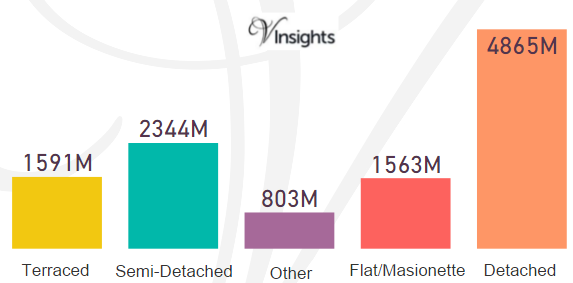
The split across the different property types in Surrey are:
- Terraced £1.59 billions (14.25%)
- Semi-Detached £2.34 billions (20.99%)
- Other £803 millions (7.19%)
- Flat/Maisonette £1.56 billions (14%)
- Detached £4.87 billions (43.57%)
Total No Of Properties Sold By Property Type
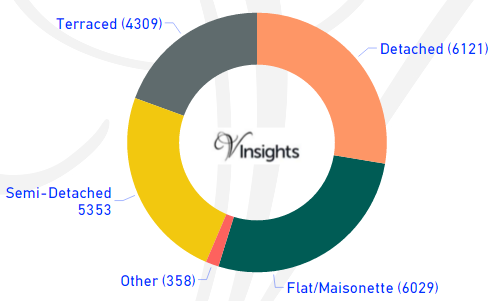
Surrey had total property sales of 22,170. The split across the different property types are:
- Detached 6121 (27.61%)
- Flat/Maisonette 6029 (27.19%)
- Other 358 (1.61%)
- Semi-Detached 5353 (24.15%)
- Terraced 4309 (19.44%)
Average & Median Sales Price
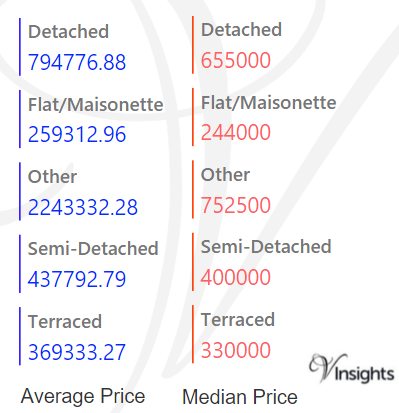
The average sales price in Surrey was £503.67 K and for the different property types it was:
- Detached £795 K
- Semi-Detached £438 K
- Terraced £369 K
- Flat/Maisonette £259 K
- Other it is £2.24 million
Similarly median sales price in Surrey was £375 K and for different property types are:
- Detached £655 K
- Semi-Detached £400 K
- Terraced £330 K
- Flat/Maisonette £244 K
- Other it is £753 k
Average & Median Sales Price By Districts
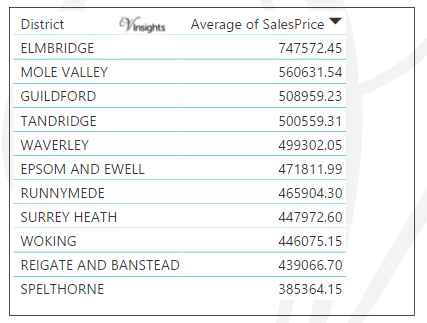
Across districts the average price is as above.
- Elmbridge £748 K
- Mole Valley £561 K
- Guildford £509 K
- Tandridge 501 K
- Waverley £499 K
- Epsom and Ewell £472 K
- Runnymede £466 K
- Surrey Heath £448 K
- Woking £446 K
- Reigate And Banstead £439 K
- Spelthorne £385 K
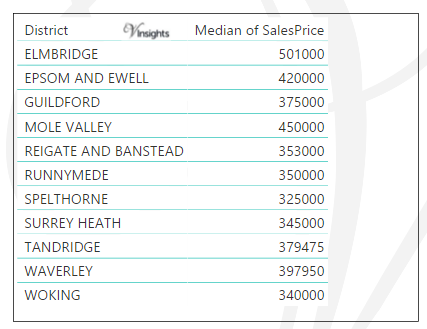
Across districts the median price is as above.
- Elmbridge £501 K
- Mole Valley £450 K
- Epsom and Ewell £420 K
- Guildford £375 K
- Reigate And Banstead £353 K
- Runnymede £350 K
- Spelthorne £325 K
- Surrey Heath £345 K
- Tandridge £380 K
- Waverley £398 K
- Woking £340 K
New Vs Not New Property Statistics
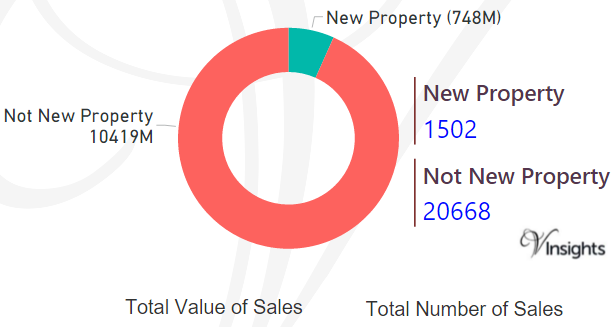
By Sales Values the split is as follows:
- New Property contributed £748 millions (6.69%)
- Not New Property contributed £10.42 billions (93.31 %)
By Total Number the split is as follows:
- New properties sold were 1,502 (6.77%)
- Not new property sold were 20,668 (93.23%)
All Surrey Posts

83057dc6-7f3b-42e9-8d48-6cda691ded8c|0|.0|27604f05-86ad-47ef-9e05-950bb762570c