| Postcode |
Coverage Area |
School |
Local Authority Area |
| BN5 |
Henfield,Blackstone,Edburton,Fulking,Small Dole,Wi neham,Woodmancote |
Details |
Horsham,Mid Sussex |
| BN18 |
Arundel,Amberley, Binsted,Burpham, Crossbush, Font well,Ford,Houghton,Madehurst,Poling,Slindon, Slind on Common,South Stoke,Tortington,Walberton,Warning camp, Wepham,Yapton |
Details |
Arun, Horsham |
| BN44 |
Steyning,Ashurst,Botolphs,Bramber,Upper Beeding,Wi ston |
Details |
Horsham |
| RH11 |
Bewbush,Broadfield,Gossops Green,Ifield,Langley Gr een,Lowfield Heath,Pease Pottage,Southgate West,We st Green |
Details |
Crawley, Mid Sussex, Horsham |
| RH12 |
Horsham,Broadbridge Heath,Rusper,Rudgwick,Warnham |
Details |
Horsham |
| RH13 |
Barns Green,Cowfold,Mannings Heath,Partridge Green ,Slinfold,Southwater,West Grinstead |
Details |
Horsham |
| RH14 |
Billingshurst,Ifold,Kirdford,Loxwood,Plaistow,Wisb orough Green |
Details |
Chichester, Horsham |
| RH20 |
Pulborough,Ashington,Storrington,West Chiltington, West Chiltington Common,Bury,Watersfield,Sutton,Fi ttleworth |
Details |
Chichester, Horsham |
All West Sussex Posts

91896a5f-f581-4384-8aab-68157142016f|0|.0|27604f05-86ad-47ef-9e05-950bb762570c
Tags :
| Postcode |
Coverage Area |
School |
Local Authority Area |
| BN5 |
Henfield,Blackstone,Edburton,Fulking,Small Dole,Wi neham,Woodmancote |
Details |
Horsham, Mid Sussex |
| BN6 |
Hassocks,Albourne,Clayton,Ditchling,Goddards Green ,Hurstpierpoint,Keymer,Newtimber,Sayers Common,Str eat,Westmeston |
Details |
Lewes, Mid Sussex |
| BN45 |
Poynings,Pyecombe,Saddlescombe |
Details |
Mid Sussex |
| RH10 |
Copthorne,Crawley Down, Domewood,Furnace Green,Nor thgate,Maidenbower,Pound Hill, Rowfant,Southgate,T hree Bridges,Tilgate |
Details |
Crawley, Mid Sussex |
| RH11 |
Bewbush,Broadfield,Gossops Green,Ifield,Langley Gr een,Lowfield Heath,Pease Pottage,Southgate West,We st Green |
Details |
Crawley, Mid Sussex,Horsham |
| RH15 |
Burgess Hill, Ditchling Common |
Details |
Mid Sussex,Lewes |
| RH16 |
Haywards Heath,Lindfield |
Details |
Mid Sussex |
| RH17 |
Ansty,Ardingly,Balcombe,Bolney, Chelwood Gate,Cuck field,Danehill,Handcross,Hickstead,Horsted Keynes, Wivelsfield,Wivelsfield Green |
Details |
Mid Sussex, Lewes,Wealden |
| RH19 |
East Grinstead,Ashurst Wood, Dormans Park,Felbridg e,Felcourt,Sharpthorne,West Hoathly |
Details |
Mid Sussex, Tandridge |
All West Sussex Posts
51f5f457-33e5-4f45-a9b7-099a9076594d|0|.0|27604f05-86ad-47ef-9e05-950bb762570c
Tags :
Story Highlights
- Epsom and Ewell had total property sales of £663 millions in 2016
- The total number of properties sold in 2016 was 1,320
- The average sales price was £503 K, whereas the median was £453 K
- New Property sales were 6.08% by value, whereas Not New Property contributed 93.92%
- Stamp duty changes caused monthly spike in March
- Brexit coupled with Stamp Duty changes had negative impact, causing it to decline by 2.5%
Epsom and Ewell is one of the districts of Surrey.
Total Sales By Property Type
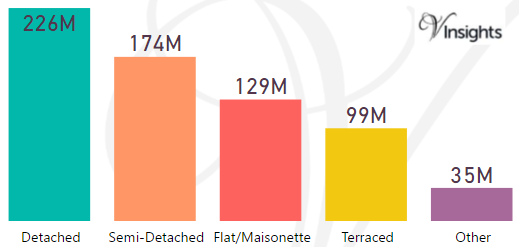
Epsom and Ewell had total property sales of £663 millions which was % of the total Surrey Property Market 2016
The split of £663 millions across the different property types are:
- Detached £226 millions (34.06%)
- Semi-Detached £174 millions (26.27%)
- Flat/Maisonette £129 millions (19.46%)
- Terraced £99 millions (14.87%)
- Other £35 millions (5.35%)
Epsom and Ewell Property Market at Postcode Level
| Postcode |
Coverage Area |
School |
Local Authority Area |
| KT4 |
Worcester Park,Cuddington, part of Old Malden,Ston eleigh |
Details |
Sutton, Epsom and Ewell, Kingston upon Thames |
| KT17 |
Epsom,Ewell,Stoneleigh |
Details |
Epsom and Ewell,Reigate and Banstead, Sutton |
| KT18 |
Epsom,Tattenham Corner,Headley,Langley Vale |
Details |
Epsom and Ewell, Mole Valley, Reigate and Banstead |
| KT19 |
Epsom, West Ewell,Stoneleigh, Horton, Longmead |
Details |
Epsom and Ewell |
| SM2 |
Belmont, South Sutton, SouthCheam, East Ewell |
Details |
Epsom and Ewell,Reigate and Banstead, Sutton |
Month-wise Break-up of Total Sales
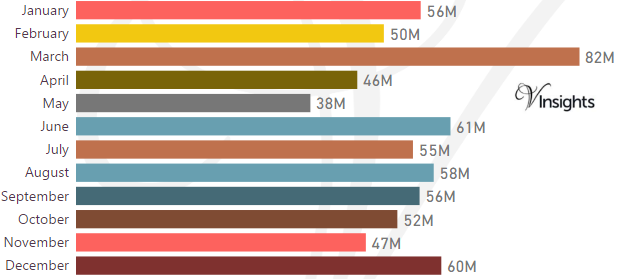
Some of the insights based on the £663 millions month-wise break-down :
Stamp Duty Hike Impact
- March had property sale spike of £82 millions compared to £50 millions in Feb and then sales sharply drop
- The impetus for it was to avoid the extra 3% in Stamp Duty Tax applicable on buying an additional home, being applicable from April 1 2016
Brexit Impact
- Brexit took place on 23rd June 2016.
- Year on Year decline has been 2.5% in 2016 over 2015
- Brexit coupled with Stamp Duty Hike had negative impact on Epsom and Ewell Property Market in 2016
Total No Of Properties Sold By Property Type
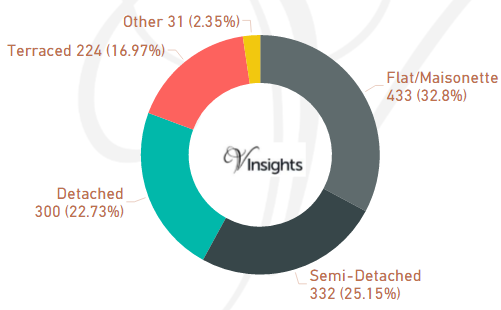
Epsom and Ewell had total property sales of 1,320. The split across the different property types are:
- Flat/Maisonette 433 (32.8%)
- Semi-Detached 332 (25.15%)
- Detached 300 (22.73%)
- Terraced 224 (16.97%)
- Other 31 (2.35%)
Average & Median Sales Price
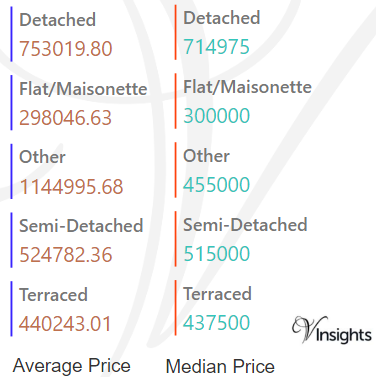
The average sales price in Epsom and Ewell was £503 K and for different property types it was:
- Detached £753 K
- Semi-Detached £525 K
- Terraced £440 K
- Flat/Maisonette £298 K
- Other it is £1.14 millions
Similarly median sales price in Epsom and Ewell was £453 K and for different property types are:
- Detached £715 K
- Semi-Detached £515 K
- Terraced £438 K
- Flat/Maisonette £300 K
- Other it is £455 K
New Vs Not New Property Statistics
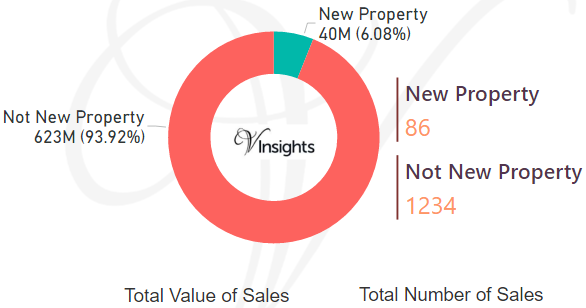
By Sales Value the split is as follows:
- New Property contributed £40 millions (6.08%)
- Not New Property contributed £623 millions (93.92%)
By Total Number the split is as follows:
- New properties sold were 86 (6.51%)
- Not new property sold were 1,234 (93.49%)
All Surrey Posts
d25ea799-dcf4-4ae0-b595-da0b09841b87|0|.0|27604f05-86ad-47ef-9e05-950bb762570c
Story Highlights
- Runnymede had total property sales of £684 millions in 2016
- The total number of properties sold in 2016 was 1401
- The average sales price was £488 K, whereas the median was £380 K
- New Property sales were 4.78% by value, whereas Not New Property contributed 95.22%
- Stamp duty changes caused monthly spike in March
- Brexit coupled with Stamp Duty changes had negative impact, causing decline of 7.3% over 2015
Runnymede is one of the districts of Surrey.
Total Sales By Property Type
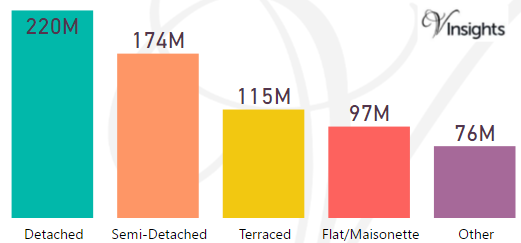
Runnymede had total property sales of £684 millions which was % of the total Surrey Property Market 2016
The split of £684 millions across the different property types are:
- Detached £220 millions (32.21%)
- Semi-Detached £174 millions (25.52%)
- Terraced £115 millions (16.86%)
- Flat/Maisonette £97 millions (14.22%)
- Other £76 millions (11.19%)
Runnymede Property Market at Postcode Level
| Postcode |
Coverage Area |
School |
Local Authority Area |
| GU25 |
Virginia Water, Wentworth |
Details |
Runnymede |
| KT13 |
Weybridge, Oatlands, Saint George's Hill, Hamm Court |
Details |
Elmbridge, Runnymede |
| KT14 |
Byfleet, West Byfleet |
Details |
Woking, Elmbridge, Runnymede |
| KT15 |
Addlestone, New Haw, Woodham |
Details |
Runnymede, Woking |
| KT16 |
Chertsey, Ottershaw, Longcross, Lyne, Dumsey Meadow in Littleton |
Details |
Runnymede, Spelthorne |
| TW18 |
Staines-upon-Thames, Egham Hythe, Laleham |
Details |
Runnymede, Spelthorne, Windsor and Maidenhead |
| TW20 |
Egham, Englefield Green, Thorpe |
Details |
Runnymede |
Month-wise Break-up of Total Sales
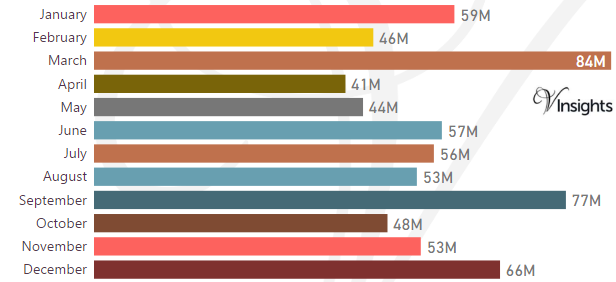
Some of the insights based on the £684 millions month-wise break-down :
Stamp Duty Hike Impact
- March had property sale spike of £84 millions compared to £46 millions in Feb and then sales sharply drop
- The impetus for it was to avoid the extra 3% in Stamp Duty Tax applicable on buying an additional home, being applicable from April 1 2016
Brexit Impact
- Brexit took place on 23rd June 2016.
- Year on Year decline has been 7.3% in 2016 over 2015
- Brexit coupled with Stamp Duty Hike had negative impact on Runnymede Property Market in 2016
Total No Of Properties Sold By Property Type
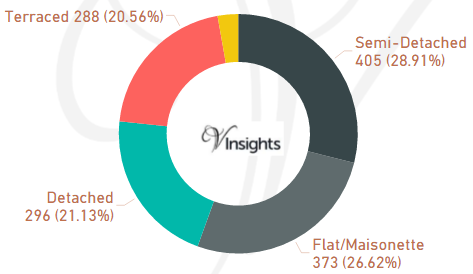
Runnymede had total property sales of 1401. The split across the different property types are:
- Semi-Detached 405 (28.91%)
- Flat/Maisonette 373 (26.62%)
- Detached 296 (21.13%)
- Terraced 288 (20.56%)
- Other 39(2.78%)
Average & Median Sales Price
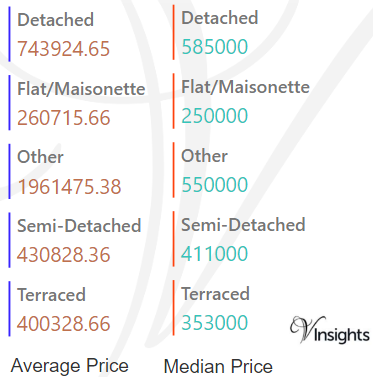
The average sales price in Runnymede was £488 K and for different property types it was:
- Detached £744 K
- Semi-Detached £431 K
- Terraced £400 K
- Flat/Maisonette £261 K
- Other it is £ 1.96 millions
Similarly median sales price in Runnymede was £380 K and for different property types are:
- Detached £585 K
- Semi-Detached £411 K
- Terraced £353 K
- Flat/Maisonette £250 K
- Other it is £550 K
New Vs Not New Property Statistics
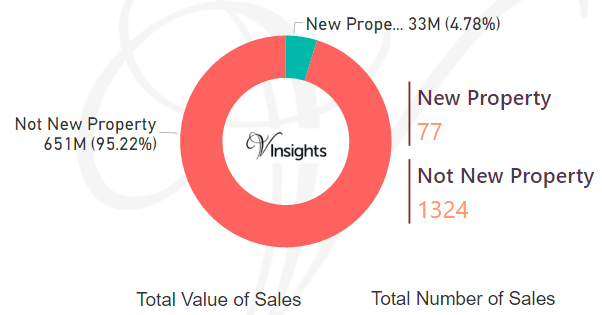
By Sales Value the split is as follows:
- New Property contributed £33 millions (4.78%)
- Not New Property contributed £651 millions (95.22%)
By Total Number the split is as follows:
- New properties sold were 77 (5.5%)
- Not new property sold were 1,324 (94.5%)
All Surrey Posts
e34f1de6-b7f4-4415-8ed3-413bc953305a|0|.0|27604f05-86ad-47ef-9e05-950bb762570c
Story Highlights
- Surrey had total property sales of £10.7 Billions in 2016,
- The year-on-year decline witnessed was 8% over 2015
- Stamp duty hike caused monthly spike in March
- The average sales price in Surrey was £527 K, whereas median was £410 K
- Across its districts average sales price in Surrey was maximum for Elmbridge at £764 K and was minimum for Epsom and Ewell at £663 millions
- New Property sales were 5.17% by value, whereas Not New Property contributed 94.83%
Total Sales By Districts
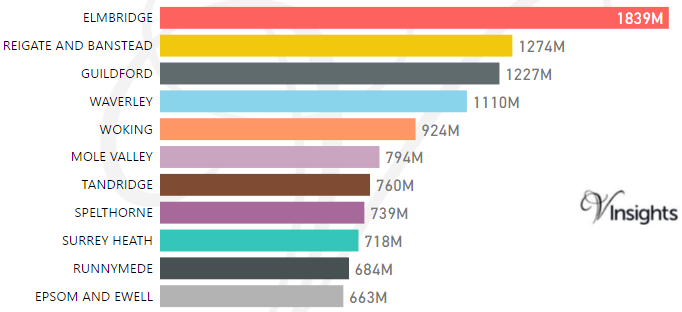
Surrey had total property sales of £10.7 Billions which was 17.34% of the total South East property Market in 2016
The split of the sales across the different districts was:
Year on Year Comparison : Compared to Surrey Property Market 2015 in 2016
- All districts except Woking, Spelthorne and Surrey Heath had decrease in total sales
Total Sales By Property Type
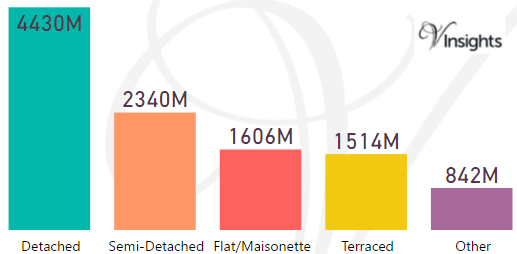
The split of £10.7 Billions in Surrey across the different property types are:
- Detached £4.4 billions (41.27%)
- Semi-Detached £2.3 billions (21.8%)
- Flat/Maisonette £1.6 billions (14.96%)
- Terraced £1.5 billions (14.11%)
- Other £842 millions (7.85%)
Year on Year Comparison : Compared to Surrey Property Market 2015 in 2016
- All the property types sales have shown decline except Flat/Maisonette and Other.
Month-wise Break-up of Total Sales
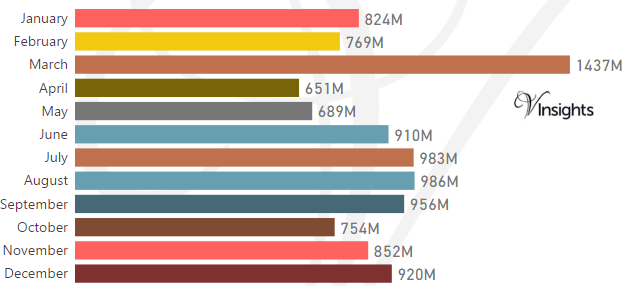
Some of the insights based on the £10.7 Billions month-wise break-down :
Stamp Duty Hike Impact
- March had property sale spike of £1.4 billions compared to £769 millions in Feb
- The impetus for it was to avoid the extra 3% in Stamp Duty Tax applicable on buying an additional home, being applicable from April 1 2016
Brexit Impact
- Brexit took place on 23rd June 2016.
- As can be observed from the month-wise break-up there does not seem to have been dip in property sales in the immediate aftermath of Brexit
- Year on Year decrease (compared to 2015) has been 8% in 2016 impacted by Brexit
- Brexit coupled with Stamp Duty Hike had negative impact on Surrey Property Market in 2016
Total No Of Properties Sold By Property Type
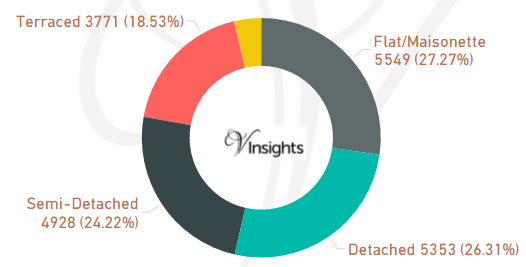
Surrey had total property sales of 20347. The split across different property types are:
- Flat/Maisonette 5,549 (27.27%)
- Detached 5,353 (26.31%)
- Semi-Detached 4,928 (24.22%)
- Terraced 3,771 (18.53%)
- Other 746(3.67%)
Year on Year Comparison : Compared to Surrey Property Market 2015 in 2016
- Total number of property sales in 2016 has decreased by 8.22%.
- All property types have shown decline in number of properties sold except property type Other
- Other has shown significant increase of 108%
Average & Median Sales Price
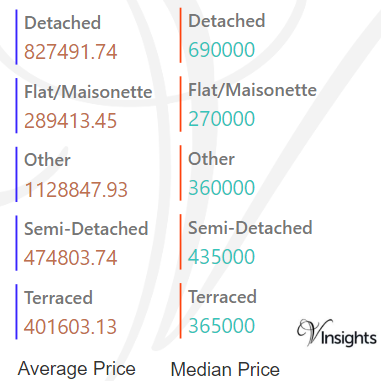
The average sales price in Surrey was £527 K. For the different property types it was
- Detached at £827 K
- Semi-Detached at £475 K
- Terraced at £402 K
- Flat/Maisonette at £289 K
- Other it is at £1.1 millions
Similarly median sales price in Surrey was £410 K. For different property types it was
- Detached at £690 K
- Semi-Detached at £435 K
- Terraced at £365 K
- Flat/Maisonette at £270 K
- Other it is at £360 K
Year on Year Comparison : Compared to Surrey Property Market 2015 in 2016
- The average and median property price have gone up except for property type Other
Average & Median Sales Price By Districts
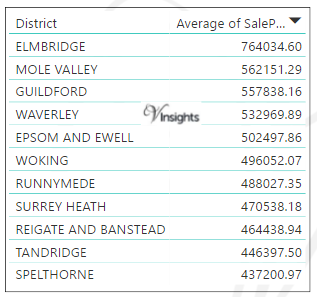
Across districts the average sales price is as above.
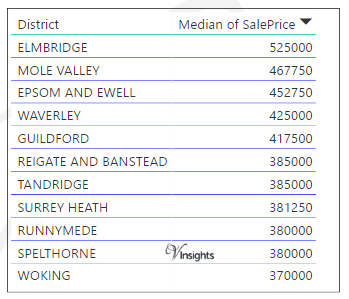 Across districts the median sales price is as above.
Year on Year Comparison : Compared to Surrey Property Market 2015 in 2016
- The average sales price across all the counties have gone up except Tandridge
- The median sales price across all the counties have gone up.
New Vs Not New Property Statistics
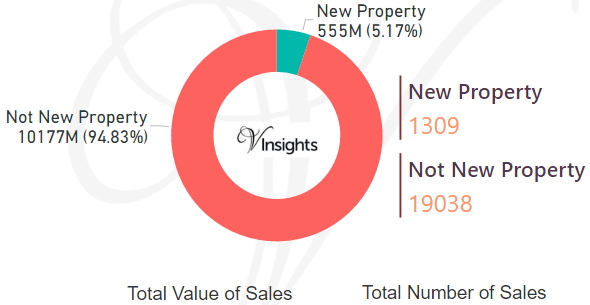
By Sales Value the split is as follows:
- New Property contributed £555 millions (5.17%)
- Not New Property contributed £10.18 billions (94.83%)
By Total Number the split is as follows:
- New properties sold were 1,309 (6.43%)
- Not new property sold were 1,9038 (93.57%)
Year on Year Comparison : Compared to Surrey Property Market 2015 in 2016
- New property market share in property market has gone down.
All Surrey Posts
5ded4f96-7d7f-4e6e-9b1d-8e29d644083e|0|.0|27604f05-86ad-47ef-9e05-950bb762570c