Story Highlights
- Epsom and Ewell had total property sales of £663 millions in 2016
- The total number of properties sold in 2016 was 1,320
- The average sales price was £503 K, whereas the median was £453 K
- New Property sales were 6.08% by value, whereas Not New Property contributed 93.92%
- Stamp duty changes caused monthly spike in March
- Brexit coupled with Stamp Duty changes had negative impact, causing it to decline by 2.5%
Epsom and Ewell is one of the districts of Surrey.
Total Sales By Property Type
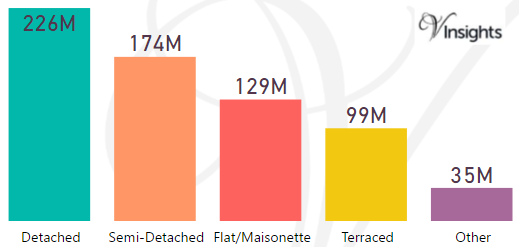
Epsom and Ewell had total property sales of £663 millions which was % of the total Surrey Property Market 2016
The split of £663 millions across the different property types are:
- Detached £226 millions (34.06%)
- Semi-Detached £174 millions (26.27%)
- Flat/Maisonette £129 millions (19.46%)
- Terraced £99 millions (14.87%)
- Other £35 millions (5.35%)
Epsom and Ewell Property Market at Postcode Level
| Postcode |
Coverage Area |
School |
Local Authority Area |
| KT4 |
Worcester Park,Cuddington, part of Old Malden,Ston eleigh |
Details |
Sutton, Epsom and Ewell, Kingston upon Thames |
| KT17 |
Epsom,Ewell,Stoneleigh |
Details |
Epsom and Ewell,Reigate and Banstead, Sutton |
| KT18 |
Epsom,Tattenham Corner,Headley,Langley Vale |
Details |
Epsom and Ewell, Mole Valley, Reigate and Banstead |
| KT19 |
Epsom, West Ewell,Stoneleigh, Horton, Longmead |
Details |
Epsom and Ewell |
| SM2 |
Belmont, South Sutton, SouthCheam, East Ewell |
Details |
Epsom and Ewell,Reigate and Banstead, Sutton |
Month-wise Break-up of Total Sales
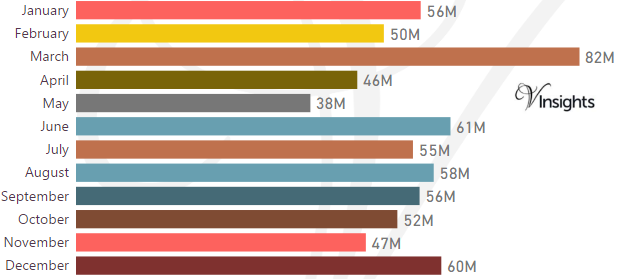
Some of the insights based on the £663 millions month-wise break-down :
Stamp Duty Hike Impact
- March had property sale spike of £82 millions compared to £50 millions in Feb and then sales sharply drop
- The impetus for it was to avoid the extra 3% in Stamp Duty Tax applicable on buying an additional home, being applicable from April 1 2016
Brexit Impact
- Brexit took place on 23rd June 2016.
- Year on Year decline has been 2.5% in 2016 over 2015
- Brexit coupled with Stamp Duty Hike had negative impact on Epsom and Ewell Property Market in 2016
Total No Of Properties Sold By Property Type
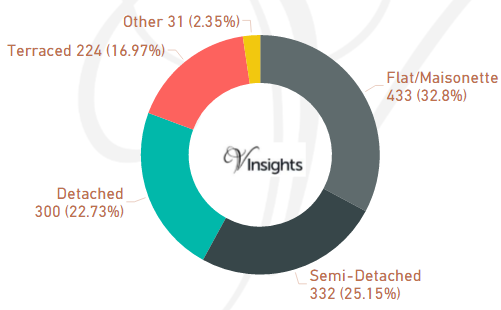
Epsom and Ewell had total property sales of 1,320. The split across the different property types are:
- Flat/Maisonette 433 (32.8%)
- Semi-Detached 332 (25.15%)
- Detached 300 (22.73%)
- Terraced 224 (16.97%)
- Other 31 (2.35%)
Average & Median Sales Price
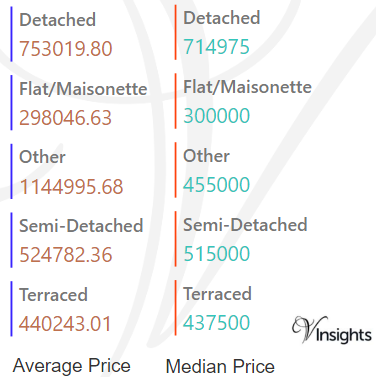
The average sales price in Epsom and Ewell was £503 K and for different property types it was:
- Detached £753 K
- Semi-Detached £525 K
- Terraced £440 K
- Flat/Maisonette £298 K
- Other it is £1.14 millions
Similarly median sales price in Epsom and Ewell was £453 K and for different property types are:
- Detached £715 K
- Semi-Detached £515 K
- Terraced £438 K
- Flat/Maisonette £300 K
- Other it is £455 K
New Vs Not New Property Statistics
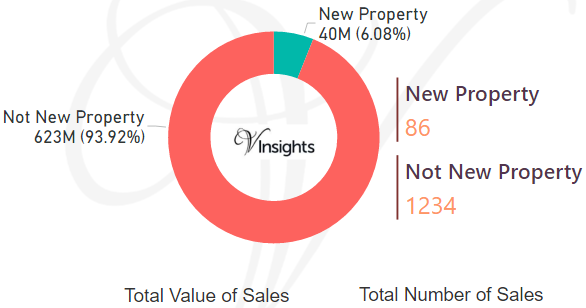
By Sales Value the split is as follows:
- New Property contributed £40 millions (6.08%)
- Not New Property contributed £623 millions (93.92%)
By Total Number the split is as follows:
- New properties sold were 86 (6.51%)
- Not new property sold were 1,234 (93.49%)
All Surrey Posts

d25ea799-dcf4-4ae0-b595-da0b09841b87|0|.0|27604f05-86ad-47ef-9e05-950bb762570c