Portsmouth Property Market 2015

Story Highlights

  • Portsmouth had total property sales of  £940 million in 2015
  • The total number of properties sold in 2015 was 3,890 properties
  • The average sales price in Portsmouth was £242 K, whereas the median sales price  was £172 K
  • New Property sales were 4.12% by value, whereas Not New Property contributed 95.88%


Portsmouth has unitary authority status in South East England.

Total Sales By Property Type

Portsmouth - Total Sales By Property Type

Portsmouth had total property sales of £940 million which was 1.54% of the total South East property Market in 2015

The split across the different property types are:

  • Detached £57 millions (6.06%)
  • Terraced £421 millions (44.77%)
  • Semi-Detached £96 millions (10.22%)
  • Flat/Maisonette £169 millions (18%)
  • Other 197 millions (20.95%)


Total No Of Properties Sold By Property Type

Portsmouth - Total No Of Properties Sold By Property Type

Portsmouth had total property sales of 3,890. The split across the different property types are:

  • Detached 161 (4.14%)
  • Flat/Maisonette 1,127 (28.97%)
  • Other 57 (1.47%)
  • Semi-Detached 379(9.74%)
  • Terraced 2,166 (55.68%)


Average & Median Sales Price

Portsmouth - Average & Median Sales Price

The average sales price in Portsmouth was £242 K and for the different property types it was:

  • Detached £354 K
  • Semi-Detached £253 K
  • Terraced £194 K
  • Flat/Maisonette £150 K
  • Other it is £3.5 millions

Similarly median sales price in Portsmouth was £172 K and for different property types are:

  • Detached £325 K
  • Semi-Detached £238 K
  • Terraced £175 K
  • Flat/Maisonette £133 K
  • Other it is £360 K


New Vs Not New Property Statistics


Portsmouth - New Vs Not New Property Statistics

By Sales Values the split is as follows:

  • New Property contributed £39 millions (4.12%)
  • Not New Property contributed £902 millions (95.88%)

By Total Number the split is as follows:

  • New properties sold were 168 (4.32%)
  • Not new property sold were 3,722 (95.68%).


All England Posts

Oxfordshire Property Market 2015

Story Highlights

  • Oxfordshire had total property sales of £4.68 Billions in 2015
  • The total number of properties sold in 2015 was 11,901.
  • The average sales price in Oxfordshire was £392.94 K, whereas median was £300 K
  • Across its districts average sales price in Oxfordshire was maximum for Oxford at £482 K and was minimum for Cherwell at £320 K
  • Similarly the median sales price in Oxfordshire was maximum for Oxford at £345 K and was minimum for Cherwell at £265 K
  • New Property sales were 12.31% by value, whereas Not New Property contributed 87.69%


Oxfordshire is one of the counties of South East England. The districts of Oxfordshire are South Oxfordshire, Vale of White Horse, Cherwell, Oxford, West Oxfordshire. Let us look at the Oxfordshire Property Market in 2015 in detail.


Total Sales By Districts

Oxfordshire - Total Sales By Districts

Oxfordshire had total property sales of £4.68 Billions which was 7.63% of the total South East property Market in 2015.

The split of the sales across the different districts was South Oxfordshire £1.18 billions (25.23%), Vale of White Horse £965 millions (20.64%), Cherwell £931 millions (19.92%), Oxford £922 millions (19.72%), West Oxfordshire £678 millions (14.49%).


Total Sales By Property Type

Oxfordshire - Total Sales By Property Type

The split across the different property types in Oxfordshire are:

  • Terraced £1.07 billions (22.84%)
  • Semi-Detached £1.06 billions (22.69%)
  • Other £335 millions (7.17%)
  • Flat/Maisonette £465 millions (9.95%)
  • Detached £1.75 billions (37.35%) 

Total No Of Properties Sold By Property Type

Oxfordshire - Total No Of Properties Sold By Property Type

Oxfordshire had total property sales of 11,901.  The split across the different property types are:

  • Detached 3,206 (26.94%)
  • Flat/Maisonette 2,059 (17.3%)
  • Other 212 (1.78%)
  • Semi-Detached 2,990 (25.12%)
  • Terraced 3,434 (28.85%)


Average & Median Sales Price

Oxfordshire - Average & Median Sales Price

The average sales price in Oxfordshire was £392.94 K and for the different property types it was:

  • Detached £388 K
  • Semi-Detached £236 K
  • Terraced £208 K
  • Flat/Maisonette £148 K
  • Other it is £2.11 million

Similarly median sales price in Oxfordshire was £300 K and for different property types are:

  • Detached £355 K
  • Semi-Detached £232 K
  • Terraced £195 K
  • Flat/Maisonette £153 K
  • Other it is £404 k


Average & Median Sales Price By Districts

Oxfordshire - Average Sales Price By Districts

Across districts the average price is as above.

  • The maximum was for Oxford at £482 K
  • South Oxfordshire £455 K
  • Vale of White Horse £381 K
  • West Oxfordshire £348 K
  • Minimum for Cherwell at £320 K.


Oxfordshire - Median Sales Price By Districts

Across districts the median price is as above.

  • The maximum was for Oxford at £345 K
  • South Oxfordshire £333 K
  • Vale of White Horse £310 K
  • West Oxfordshire £285 K
  • Minimum for Cherwell at £265 K


New Vs Not New Property Statistics

Oxfordshire - New Vs Not New Property Statistics

By Sales Values the split is as follows:

  • New Property contributed £576 millions (12.31%)
  • Not New Property contributed £4.1 billions (87.69%)

By Total Number the split is as follows:

  • New properties sold were 1,622 (86.37%)
  • Not new property sold were 10,279 (13.63%)


All Oxfordshire Posts


Milton Keynes Property Market 2015

 For 2016 details - Milton Keynes Property Market 2016 

Story Highlights

  • Milton Keynes had total property sales of £1.45 Billions in 2015
  • The total number of properties sold in 2015 was 5,067 properties
  • The average sales price in Milton Keynes was £286 K, whereas the median sales price was £229 K
  • New Property sales were 15.31% by value, whereas Not New Property contributed 84.69%


Milton Keynes has unitary authority status in South East England.

Total Sales By Property Type

Milton Keynes - Total Sales By Property Type

Milton Keynes had total property sales of £1.45 billions which was 2.37% of South East England.

The split across the different property types are:

  • Terraced £320 millions (22.09%)
  • Semi-Detached £256 millions (17.68%)
  • Other £169 millions (11.67%)
  • Flat/Maisonette £131 millions (9.04%)
  • Detached £573 millions (39.52%)


Total No Of Properties Sold By Property Type

Milton Keynes - Total No Of Properties Sold By Property Type

Milton Keynes had total property sales of 5,067.  The split across the different property types are:

  • Detached 1,476 (29.13%)
  • Flat/Maisonette 885 (17.47%)
  • Other 80 (1.58%)
  • Semi-Detached 1,086 (21.43%)
  • Terraced 1,540 (30.39%)


Average & Median Sales Price

Milton Keynes - Average & Median Sales Price

The average sales price in Milton Keynes was £286 K and for the different property types it was:

  • Detached £388 K
  • Semi-Detached £236 K
  • Terraced £208 K
  • Flat/Maisonette £148 K
  • Other it is £2.11 millions

Similarly median sales price in Milton Keynes was £229 K and for the different property types it was:

  • Detached £355 K
  • Semi-Detached £232 K
  • Terraced £195 K
  • Flat/Maisonette £153 K
  • Other it is £404 K


New Vs Not New Property Statistics

Milton Keynes - New Vs Not New Property Statistics


By Sales Values the split is as follows:

  • New Property contributed £222 millions (15.31%)
  • Not New Property contributed £1.23 billions (84.69%)

By Total Number the split is as follows:

  • New properties sold were 753 (14.86%)
  • Not new property sold were 4,314 (85.14%)


 All England Posts


Medway Property Market 2015

 For 2016 details - Medway Property Market 2016 

Story Highlights

  • Medway had total property sales of £1.14 Billions in 2015
  • The total number of properties sold in 2015 was 5,113 properties
  • The average sales price in Medway was £223 K, whereas the median sales price was £190 K
  • New Property sales were 8.65% by value, whereas Not New Property contributed 91.35%


 Medway has unitary authority status in South East England.

Total Sales By Property Type

Medway - Total Sales By Property Type

Medway had total property sales of £1.14 Billions which was 1.86% of  the total South East property Market in 2015.

The split across the different property types are:

  • Terraced £434 millions (38.09%)
  • Semi-Detached £303 millions (26.62%)
  • Other £65 millions (5.67%)
  • Flat/Maisonette £115 millions (10.08%)
  • Detached £223 millions (19.54%)


Total No Of Properties Sold By Property Type

Medway - Total No Of Properties Sold By Property Type

Medway had total property sales of 5,113.  The split across the different property types are:

  • Detached 652 (12.75%)
  • Flat/Maisonette  788 (15.41%)
  • Other 82 (1.6%)
  • Semi-Detached 1,173 (22.94%)
  • Terraced 2,418 (47.29%)


Average & Median Sales Price

Medway - Average & Median Sales Price

The average sales price in Medway was £223 K and for the different property types it was:

  • Detached £342 K
  • Semi-Detached £259 K
  • Terraced £180 K
  • Flat/Maisonette £146 K
  • Other it is £788 K

Similarly median sales price in Medway was £190 K and for the different property types it was:

  • Detached £325 K
  • Semi-Detached £230 K
  • Terraced £170 K
  • Flat/Maisonette £140 K
  • Other it is £296 K


New Vs Not New Property Statistics

Medway - New Vs Not New Property Statistics

By Sales Values the split is as follows:

  • New Property contributed £99 millions (8.65%)
  • Not New Property contributed £1.04 billions (91.35 %)

By Total Number the split is as follows:

  • New properties sold were 403 (7.88%)
  • Not new property sold were 4,710 (92.12%)


All South East England Posts

Kent Property Market 2015

For 2016 details - Kent Property Market 2016 

Story Highlights

  • Kent had total property sales of £8.75 Billions in 2015
  • The total number of properties sold in 2015 was 30,003.
  • The average sales price in Kent was £291.76 K, whereas the median was £236 K
  • Across it's districts average sales price was maximum for Sevenoaks at £466 K and minimum for Thanet at £204 K
  • New Property sales were 9.73% by value, whereas Not New Property contributed 90.27%.


Kent is one of the counties of South East England.The districts of Kent are Tunbridge Wells, Maidstone, Sevenoaks, Tonbridge and Malling, Canterbury, Ashford, Dartford, Thanet, Swale, Dover, Shepway, Gravesham. Let us look at the Kent Property Market for 2015 in detail.


 Total Sales By Districts
Kent - Total Sales By Districts

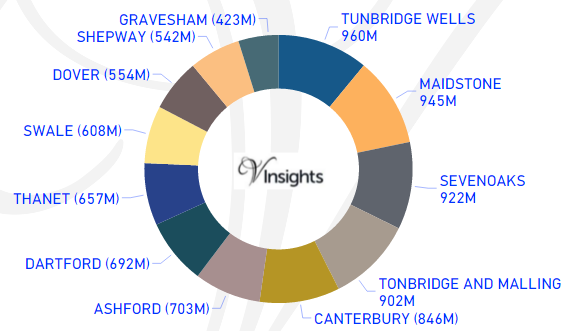
Kent had total property sales of  £8.75 Billions which was 14.29% of the total South East property Market in 2015.

 The split of the sales across the different districts was:

  • Tunbridge Wells £960 millions (10.97%)
  • Maidstone £945 millions (10.8%)
  • Sevenoaks £922 millions (10.53%)
  • Tonbridge and Malling £902 millions (10.3%)
  • Canterbury £846 millions (9.67%)
  • Ashford £703 millions (8.03%)
  • Dartford £692 millions (7.9%)
  • Thanet £657 millions (7.5%)
  • Swale £608 millions (6.95%)
  • Dover £554 millions (6.33%)
  • Shepway £542 millions (6.19%)
  • Gravesham £ 423 millions (4.83%)


Total Sales By Property Type
Kent - Total Sales By Property Type

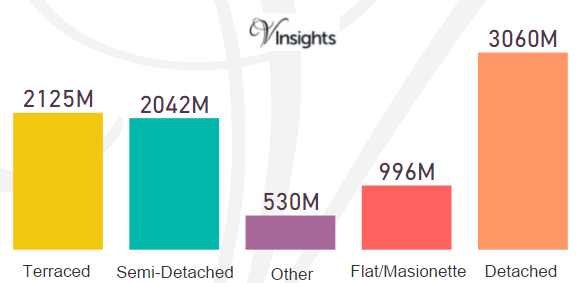
The split by Sales value across the different property types in Kent are:

  • Terraced £2.13 billions (24.28%)
  • Semi-Detached £2.04 billions (23.32%)
  • Other £530 millions (6.06%)
  • Flat/Maisonette £996 millions (11.38%)
  • Detached £3.06 billions (34.96%)


Total No Of Properties Sold By Property Type
Kent - Total No Of Properties Sold By Property Type

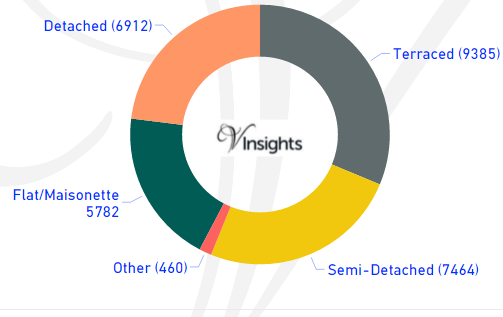
Kent had total property sales of 30,003.  The split across the different property types are:

  • Detached 6,912 (23.04%)
  • Flat/Maisonette 5,782 (19.27%)
  • Other 460 (1.53%)
  • Semi-Detached 7464 (24.88%)
  • Terraced 9385 (31.28%)


Average & Median Sales Price
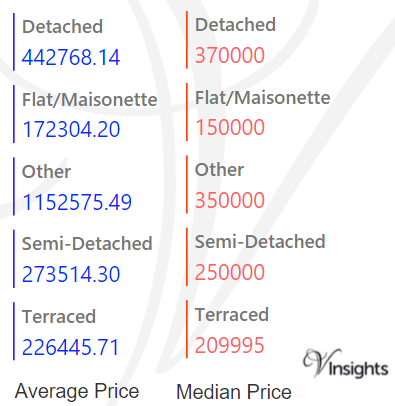
Kent - Average & Median Sales Price

The average sales price in Kent was £291.76 K and for the different property types it was:

  • Detached £443 K
  • Semi-Detached £274 K
  • Terraced £226 K
  • Flat/Maisonette £172 K
  • Other it is £1.15 million

Similarly median sales price in Kent was £236 K and for the different property types it was:

  • Detached £370 K
  • Semi-Detached £250 K
  • Terraced £210 K
  • Flat/Maisonette £150 K
  • Other it is £350 k


Average & Median Sales Price By Districts
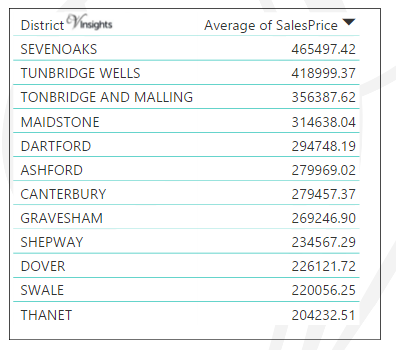
Kent - Average Sales Price By Districts

Across districts the average price is as above.

  • The maximum average sales price is for Sevenoaks at £466 K
  • Tunbridge Wells £419 K
  • Tonbridge And Malling £356 K
  • Maidstone £314 K
  • Dartford £295 K
  • Ashford £280 K
  • Canterbury £280 K
  • Gravesham £269 K
  • Shepway £234 K
  • Dover £226 K
  • Swale £220 K
  • Minimum for  Thanet at £204 K


Kent - Median Sales Price By Districts

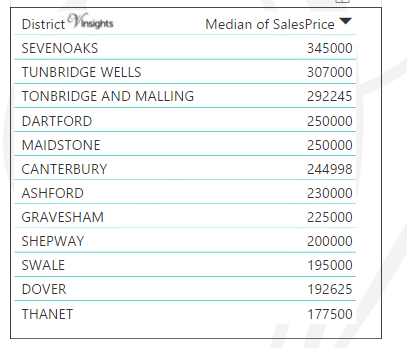
Across districts the median price is as above.

  • The maximum average sales price is for Sevenoaks at £345 K
  • Tunbridge Wells £307 K
  • Tonbridge And Malling £292 K
  • Dartford £250 K
  • Maidstone £250 K
  • Canterbury £245 K
  • Ashford £230 K
  • Gravesham £225 K
  • Shepway £200 K
  • Swale £195 K
  • Dover £193 K
  • Minimum for Thanet at £178 K


New Vs Not New Property Statistics
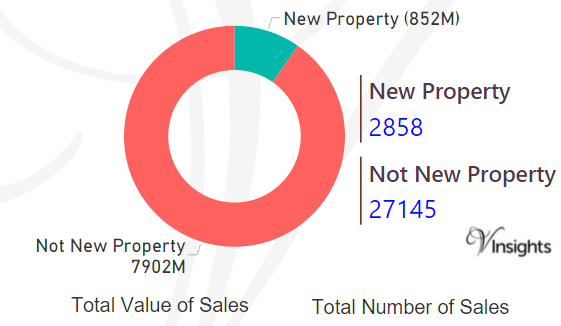
 

Kent - New Vs Not New Property Statistics

By Sales Values the split is as follows:

  • New Property contributed £852 millions (9.73%)
  • Not New Property contributed £7.9 billions (90.27 %)

By Total Number the split is as follows:

  • New properties sold were 2,858 (9.53%)
  • Not new property sold were 27,145 (90.47%)


 All Kent Posts