Story Highlights
- Brighton And Hove had total property sales of £2.16 Billions in 2016
- The total number of properties sold in 2016 was 5,392 properties
- The average sales price in Brighton And Hove was £401 K, whereas median was £325 K
- New Property sales were 5.24% by value and Not New contributed 94.76%
- Stamp duty hike caused monthly spike in March
- Year on Year growth over 2015 has been 3.95% so there has been no negative impact of Brexit and Stamp Duty Hike
Brighton and Hove is an unitary authority area in South East England.
Total Sales By Property Type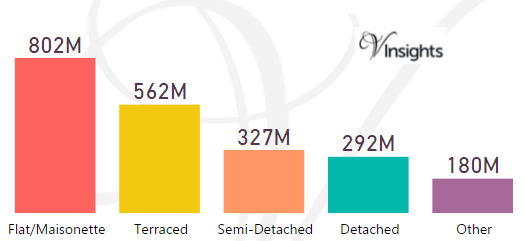
Brighton and Hove had total property sales of £2.16 Billions which was 3.5% of the South East England property Market in 2016
The split across the different property types in Brighton And Hove are:
- Flat/Maisonette £802 millions (37.08%)
- Terraced £562 millions (25.97%)
- Semi-Detached £327 millions (15.13%)
- Detached £292 millions (13.51%)
- Other £180 millions (8.3%)
Year on Year Comparison : Compared to Brighton And Hove Property Market 2015 in 2016
- All the property types total sales have shown growth except Detached
Brighton And Hove Property Market at Postcode level
| Postcode |
Coverage Area |
School |
Local Authority Area |
| BN1 |
Brighton,Coldean,Falmer,Hollingbury,Patcham,Presto n,Stanmer,Withdean |
Details |
Brighton and Hove,Lewes |
| BN2 |
Brighton,Bevendean,Brighton Marina,Kemptown,Moulse coomb,Ovingdean,Rottingdean,Saltdean,Woodingdean |
Details |
Brighton and Hove, Lewes |
| BN3 |
Hove,Aldrington,Hangleton,West Blatchington |
Details |
Brighton and Hove |
| BN41 |
Fishersgate,Portslade |
Details |
Adur, Brighton and Hove |
Month-wise Break-up of Total Sales
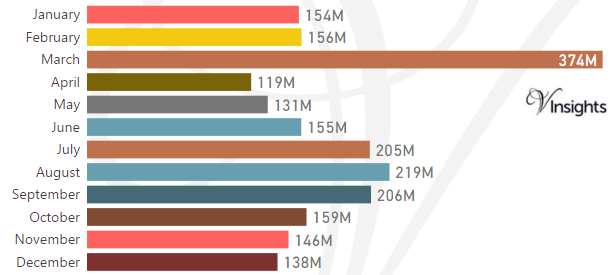
Some of the insights based on the £2.16 Billions month-wise break-down :
Stamp Duty Hike Impact
- March had property sale spike of £374 millions compared to £156 millions in Feb
- The impetus for it was to avoid the extra 3% in Stamp Duty Tax applicable on buying an additional home, being applicable from April 1 2016
Brexit Impact
- Brexit took place on 23rd June 2016.
- As can be observed from the month-wise break-up there does not seem to have been dip in property sales in the immediate aftermath of Brexit
- Year on Year growth has been 3.95% so there does not seem to have been negative impact of Brexit and Stamp Duty Hike
Total No Of Properties Sold By Property Type
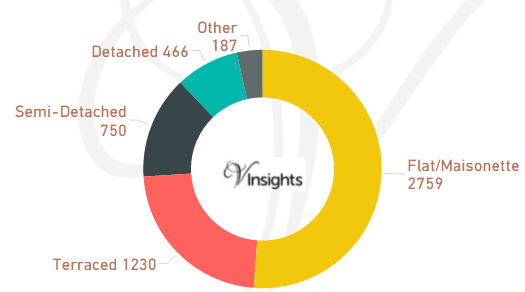
Brighton And Hove had total property sales of 5,392. The split across the different property types are:
- Flat/Maisonette 2,759 (51.17%)
- Terraced 1,230 (22.81%)
- Semi-Detached 750 (%)
- Detached 466 (13.91%)
- Other 187 (3.47%)
Year on Year Comparison : Compared to Brighton And Hove Property Market 2015 in 2016
- Total number of property sales in 2016 has decreased by 5.62%.
- All property types have shown decline in number of properties sold except property type Other.
- Other has shown significant increase of 80%
Average & Median Sales Price
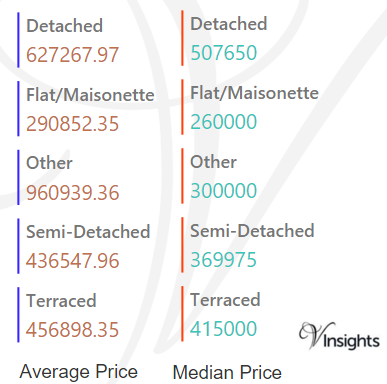
The average sales price in Brighton And Hove was £401 K and for different property types it was:
- Detached £627 K
- Semi-Detached £437 K
- Terraced £457 K
- Flat/Maisonette £291 K
- Other it is £961 K
Similarly median sales price in Brighton And Hove was £325 K and for different property types are:
- Detached £508 K
- Semi-Detached £370 K
- Terraced £415 K
- Flat/Maisonette £260 K
- Other it is £300 K
Year on Year Comparison : Compared to Brighton And Hove Property Market 2015 in 2016
- The average and median property prices have gone up except for property type Other
- Other has had decline in average and median property price
New Vs Not New Property Statistics
By Sales Values the split is as follows:
- New Property contributed £113 millions (5.24%)
- Not New Property contributed £2.05 billions (94.76%)
By Total Number the split is as follows:
- New properties sold were 285 (5.29%)
- Not new property sold were 5,107 (94.71%)
Year on Year Comparison : Compared to Brighton And Hove Property Market 2015 in 2016
- New property market share in property market has gone up in 2016 over 2015
All South East England Post

a3334e94-59ca-4dca-a3aa-1db31b8c0ce9|0|.0|27604f05-86ad-47ef-9e05-950bb762570c
For 2016 details - Brighton And Hove Property Market 2016
Story Highlights
- Brighton And Hove had total property sales of £2.078 Billions in 2015
- The total number of properties sold in 2015 was 5,695 properties
- The average sales price in Brighton And Hove was £365 K, whereas median was £300 K
- New Property sales were 4.84% by value, where as Not New Property contributed 95.16%
Brighton and Hove is an unitary authority area in South East England.
Total Sales By Property Type
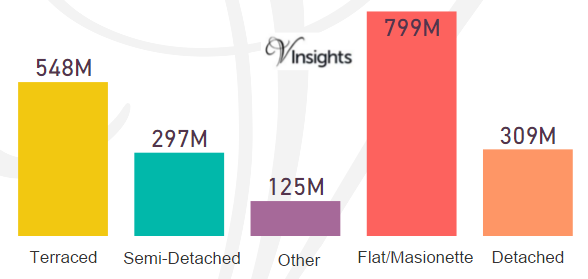
Brighton and Hove had total property sales of £2.078 Billions which was 3.39% of the total South East property Market in 2015.
The split across the different property types in Brighton And Hove are:
- Terraced £548 millions (26.37%)
- Semi-Detached £297 millions (14.29%)
- Other £125 millions (6.01%)
- Flat/Maisonette £799 millions (38.46%)
- Detached £309 millions (14.86%)
Total No Of Properties Sold By Property Type
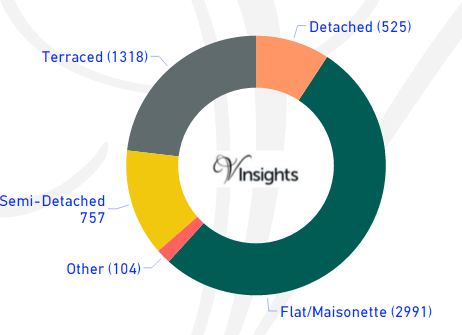
Brighton And Hove had total property sales of 5,695. The split across the different property types are:
- Detached 525 (9.22%)
- Flat/Maisonette 2991 (52.52%)
- Other 104 (1.83%)
- Semi-Detached 757 (13.29%)
- Terraced 1318 (23.14%)
Average & Median Sales Price
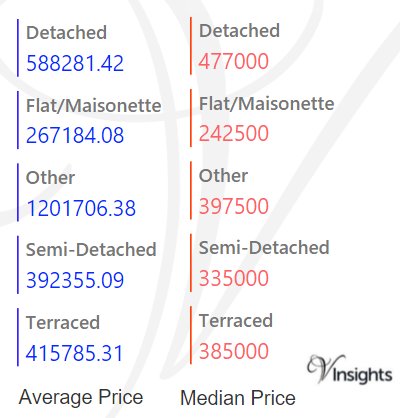
The average sales price in Brighton And Hove was £365 K and for different property types it was:
- Detached £588 K
- Semi-Detached £392 K
- Terraced £416 K
- Flat/Maisonette £267 K
- Other it is £1.2 millions
Similarly median sales price in Brighton And Hove was £300 K and for different property types are:
- Detached £477 K
- Semi-Detached £335 K
- Terraced £385 K
- Flat/Maisonette £243 K
- Other it is £398 K
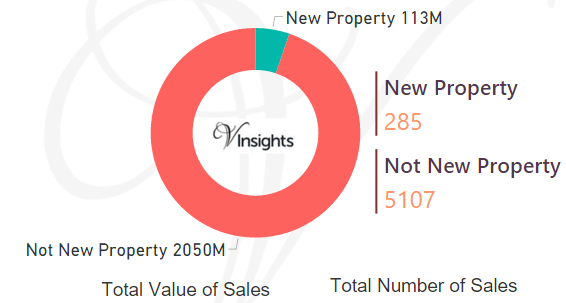
New Vs Not New Property Statistics
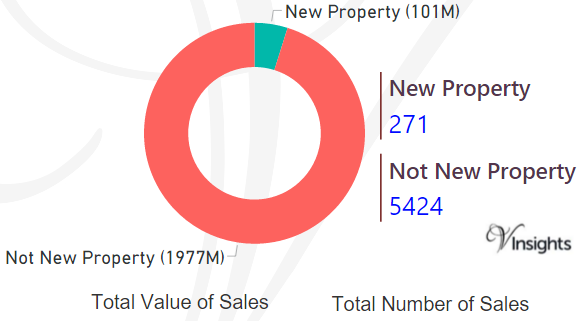
By Sales Values the split is as follows:
- New Property contributed £101 millions (4.84%)
- Not New Property contributed £1.98 billions (95.16%)
By Total Number the split is as follows:
- New properties sold were 271 (4.76%)
- Not new property sold were 5,424 (95.24%)
All England Posts
4c0b2942-7ee6-4226-b104-afa4d31e8357|0|.0|27604f05-86ad-47ef-9e05-950bb762570c