Story Highlights
- Swale had total property sales of £638 millions in 2016
- The total number of properties sold in 2016 was 2617
- The average sales price was £244 K, whereas the median was £220 K
- New Property sales were 9.42% by value, whereas Not New Property contributed 90.58%
- Stamp duty changes caused monthly spike in March
- Brexit coupled with Stamp Duty changes did not have negative impact, there was robust growth of 5%
Swale is one of the districts of Kent
Total Sales By Property Type
Swale had total property sales of £638 millions which was 6.85% of the total Kent Property Market 2016
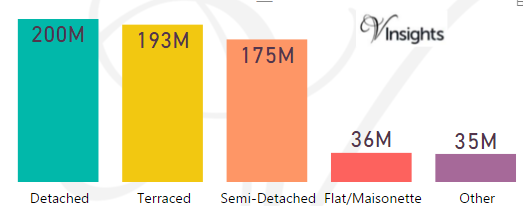
The split £638 millions across the different property types are:
- Detached £200 millions (31.32%)
- Terraced £193 millions (30.2%)
- Semi-Detached £175 millions (27.37%)
- Flat/Maisonette £36 millions (5.66%)
- Other £35 millions (5.45%)
Swale Property Market at Postcode Level
| Postcode |
Coverage Area |
School |
Local Authority Area |
| ME9 |
Newington,Teynham,Iwadeand Rural |
Details |
Swale |
| ME10 |
Sittingbourne,Kemsley,Milton Regis |
Details |
Swale |
| ME11 |
Queenborough,Rushenden |
Details |
Swale |
| ME12 |
Isle of Sheppey,Minster,Sheerness,Eastchurch |
Details |
Swale |
| ME13 |
Faversham,Boughton under Blean,Sellingand rural ar ea |
Details |
Swale |
Month-wise Break-up of Total Sales
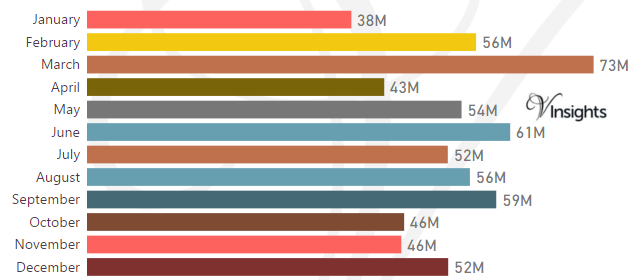
Some of the insights based on the £638 millions month-wise break-down :
Stamp Duty Hike Impact
- March had property sale spike of £73 millions compared to £56 millions in Feb
- The impetus for it was to avoid the extra 3% in Stamp Duty Tax applicable on buying an additional home, being applicable from April 1 2016
Brexit Impact
- Brexit took place on 23rd June 2016.
- Year on Year growth has been 5% in 2016 over 2015
- Brexit coupled with Stamp Duty Hike did not have negative impact on Swale Property Market in 2016
Total No Of Properties Sold By Property Type
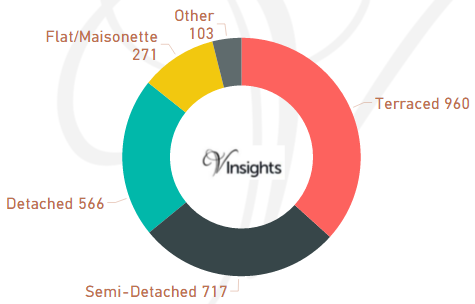
Swale had total property sales of 2617. The split across different property types are:
- Terraced 960 (36.68%)
- Semi-Detached 717 (27.4%)
- Detached 566 (21.63%)
- Flat/Maisonette 271 (10.36%)
- Other 103 (3.94%)
Average & Median Sales Price
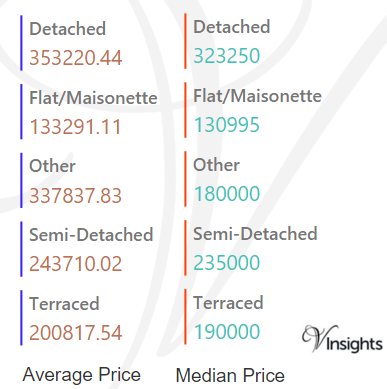
The average sales price in Swale was £244 K and for the different property types it was:
- Detached £353 K
- Semi-Detached £244 K
- Terraced £201 K
- Flat/Maisonette £133 K
- Other it is £338 K
Similarly median sales price in Swale was £220 K and for the different property types are:
- Detached £323 K
- Semi-Detached £235 K
- Terraced £190 K
- Flat/Maisonette £131 K
- Other it is £180 K
New Vs Not New Property Statistics
By Sales Value the split is as follows:
- New Property contributed £60 millions (9.42%)
- Not New Property contributed £578 millions (90.58%)
By Total Number the split is as follows:
- New properties sold were 229 (8.75%)
- Not new property sold were 2,388 (91.25%)
All Kent Posts

c4bfddb6-3b46-4824-967d-a21771940197|0|.0|27604f05-86ad-47ef-9e05-950bb762570c
Story Highlights
- Dartford had total property sales of £742 millions in 2016
- The total number of properties sold in 2016 was 2366
- The average sales price in Dartford was £313 K, whereas the median was £280 K
- New Property sales were 21.6% by value, whereas Not New Property contributed 78.4%.
- Stamp duty changes caused monthly spike in March
- Brexit coupled with Stamp Duty changes did not have negative impact, there was robust growth of 7.2%
Darford is one of the districts of Kent
Total Sales By Property Type
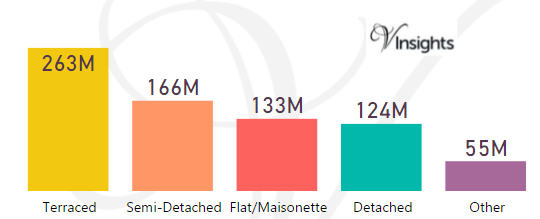
Dartford had total property sales of £742 millions which was 7.95% of the total Kent Property Market 2016
The split of £742 millions across the different property types are:
- Terraced £263 millions (35.48%)
- Semi-Detached £166 millions (22.41%)
- Flat/Maisonette £133 millions (17.94%)
- Detached £124 millions (16.7%)
- Other £55 millions (7.47%)
Dartford Property Market at Postcode Level
| Postcode |
Coverage Area |
School |
Local Authority Area |
| BR8 |
Swanley,Hextable,Crockenhill,Swanley Village |
Details |
Sevenoaks, Bromley, Dartford |
| DA1 |
Dartford,Crayford,Barnes Cray |
Details |
Bexley, Dartford |
| DA2 |
Dartford(east),Stone,Wilmington,Bean,Hawley,Darent h, part ofJoydens Wood |
Details |
Dartford,Sevenoaks |
| DA3 |
Longfield,Hartley,New Ash Green,New Barn,Fawkham |
Details |
Dartford,Gravesham, Sevenoaks |
| DA4 |
Farningham,Eynsford,South Darenth,Sutton-at-Hone,H orton Kirby |
Details |
Dartford, Sevenoaks |
| DA5 |
Bexley, parts ofAlbany ParkandJoydens Wood |
Details |
Bexley, Dartford |
| DA9 |
Greenhithe,Stone |
Details |
Dartford |
| DA10 |
Swanscombe,Ebbsfleet |
Details |
Dartford |
| DA11 |
Gravesend(west),Northfleet |
Details |
Dartford, Gravesham |
| DA13 |
Meopham,Istead Rise,Vigo,Southfleet |
Details |
Dartford, Gravesham, Sevenoaks,Tonbridge and Malling |
Month-wise Break-up of Total Sales
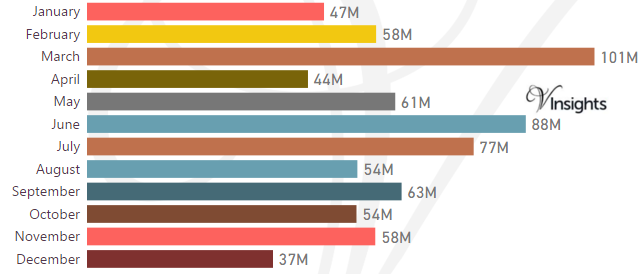
Some of the insights based on the £742 millions month-wise break-down:
Stamp Duty Hike Impact
- March had property sale spike of £101 millions compared to £58 millions in Feb
- The impetus for it was to avoid the extra 3% in Stamp Duty Tax applicable on buying an additional home, being applicable from April 1 2016
Brexit Impact
- Brexit took place on 23rd June 2016.
- Year on Year growth has been 7.2% in 2016 over 2015
- Brexit coupled with Stamp Duty Hike did not have negative impact on Dartford Property Market in 2016
Total No Of Properties Sold By Property Type
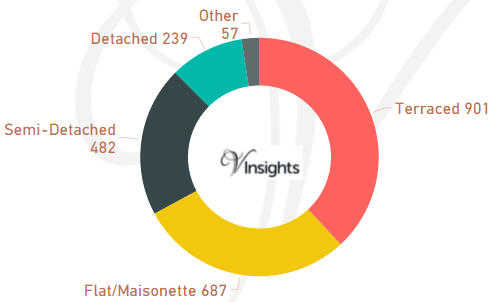
Dartford had total property sales of 2366. The split across different property types are:
- Terraced 901 (38.08%)
- Flat/Maisonette 687 (%)
- Semi-Detached 482 (20.37%)
- Detached 239 (10.1%)
- Other 57 (2.41%)
Average & Median Sales Price
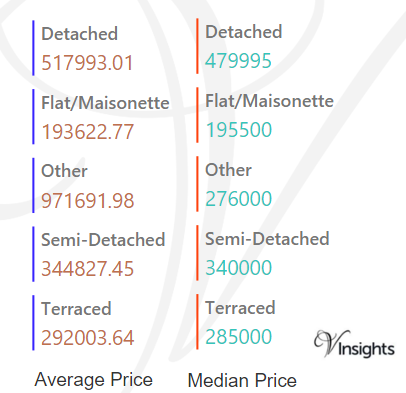
The average sales price in Dartford was £313 K and for the different property types it was:
- Detached £518 K
- Semi-Detached £345 K
- Terraced £292 K
- Flat/Maisonette £194 K
- Other it is £972 K
Similarly median sales price in Dartford was £280 K and for the different property types are:
- Detached £480 K
- Semi-Detached £340 K
- Terraced £285 K
- Flat/Maisonette £196 K
- Other it is £276 K
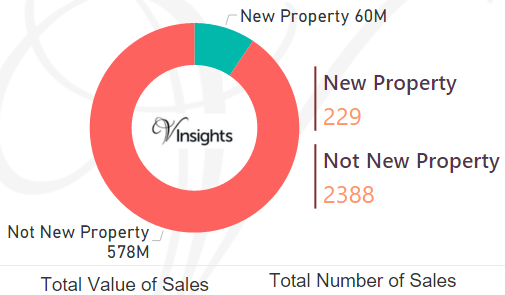
New Vs Not New Property Statistics
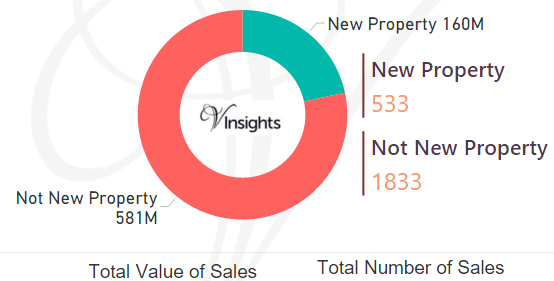
By Sales Value the split is as follows:
- New Property contributed £160 millions (21.6%)
- Not New Property contributed £581 millions (78.4%)
By Total Number the split is as follows:
- New properties sold were 533 (22.53%)
- Not new property sold were 1,833 (77.47%)
All Kent Posts
65fd2ab4-9772-48c0-a8de-6a3e188a451e|0|.0|27604f05-86ad-47ef-9e05-950bb762570c
Story Highlights
- Ashford had total property sales of £772 millions in 2016
- The total number of properties sold in 2016 was 2,636
- The average sales price was £293 K, whereas the median was £240 K
- New Property sales were 17.43% by value, whereas Not New Property contributed 82.57%
- Stamp duty changes caused monthly spike in March
- Brexit coupled with Stamp Duty changes did not have negative impact, there was robust growth of 10%
Ashford is one of the districts of Kent
Total Sales By Property Type
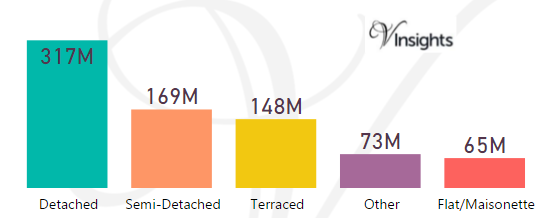
Ashford had total property sales of £772 millions which was 8.28% of the total Kent Property Market 2016
The split £772 millions across the different property types are:
- Detached £317 millions (41.04%)
- Semi-Detached £169 millions (21.87%)
- Terraced £148 millions (19.19%)
- Other £73 millions (9.5%)
- Flat/Maisonette £65 millions (8.4%)
Ashford Property Market at Postcode Level
| Postcode |
Coverage Area |
School |
Local Authority Area |
| CT4 |
Chartham,Bridge |
Details |
Canterbury, Ashford |
| TN17 |
Cranbrook,Goudhurst,Benenden,Frittenden |
Details |
Ashford, Tunbridge Wells |
| TN23 |
Ashford(town centre),Kingsnorth,Singleton |
Details |
Ashford |
| TN24 |
Willesborough,Kennington,Boughton Aluph, Goat Lees |
Details |
Ashford |
| TN25 |
Challock,Wye,Stowting,Brook |
Details |
Ashford,Shepway |
| TN26 |
Bethersden,Hamstreet,Shadoxhurst,Woodchurch |
Details |
Ashford |
| TN27 |
Headcorn,Biddenden |
Details |
Ashford, Maidstone |
| TN30 |
Tenterden,Wittersham |
Details |
Ashford |
Month-wise Break-up of Total Sales
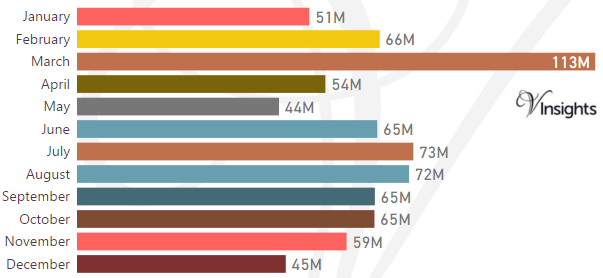
Some of the insights based on the £772 millions month-wise break-down :
Stamp Duty Hike Impact
- March had property sale spike of £113 millions compared to £66 millions in Feb
- The impetus for it was to avoid the extra 3% in Stamp Duty Tax applicable on buying an additional home, being applicable from April 1 2016
Brexit Impact
- Brexit took place on 23rd June 2016.
- Year on Year growth has been 10% in 2016 over 2015
- Brexit coupled with Stamp Duty Hike did not have negative impact and there was robust growth
Total No Of Properties Sold By Property Type
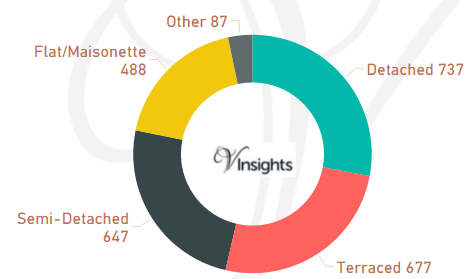
Ashford had total property sales of 2636. The split across the different property types are:
- Detached 737 (27.96%)
- Terraced 677 (25.68%)
- Semi-Detached 647 (24.54%)
- Flat/Maisonette 488 (18.51%)
- Other 87 (3.3%)
Average & Median Sales Price

The average sales price in Ashford was £293 K and for different property types it was:
- Detached £430 K
- Semi-Detached £261 K
- Terraced £219 K
- Flat/Maisonette £133 K
- Other it is £842 K
Similarly median sales price in Ashford was £240 K and for different property types are:
- Detached £380 K
- Semi-Detached £245 K
- Terraced £205 K
- Flat/Maisonette £130 K
- Other it is £340 K
New Vs Not New Property Statistics
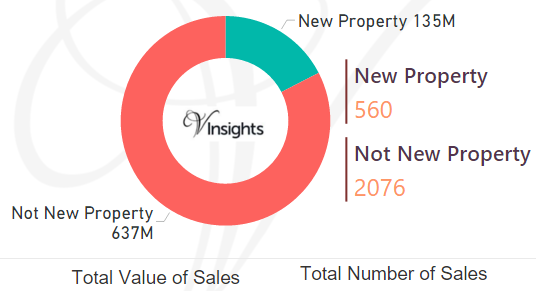
By Sales Value the split is as follows:
- New Property contributed £135 millions (17.43%)
- Not New Property contributed £637 millions (82.57%)
By Total Number the split is as follows:
- New properties sold were 560 (21.24%)
- Not new property sold were 2,076 (78.76%)
All Kent Posts
8a7d89ea-471c-4b8a-bf53-ddcd4b7d7d9c|0|.0|27604f05-86ad-47ef-9e05-950bb762570c
Story Highlights
- Tonbridge and Malling had total property sales of £938 millions in 2016
- The total number of properties sold in 2016 was 2492
- The average sales price in Tonbridge and Malling was £376 K, whereas the median was £320 K
- New Property sales were 15.74% by value, whereas Not New Property contributed 84.26%.
- Stamp duty changes caused monthly spike in March
- Brexit coupled with Stamp Duty changes did not have negative impact, there was growth of 4%
Tonbridge and Malling is one of the districts of Kent.
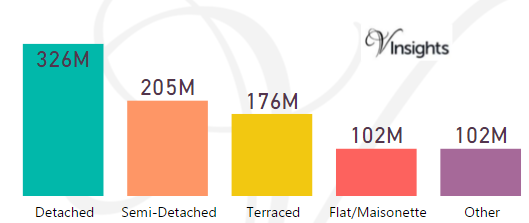
Total Sales By Property Type
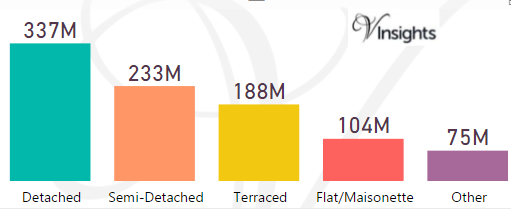
Tonbridge and Malling had total property sales of £938 millions which was 10.06% of the total Kent Property Market 2016
The split £938 millions across the different property types are:
- Detached £337 millions (35.97%)
- Semi-Detached £233 millions (24.85%)
- Terraced £188 millions (20.07%)
- Flat/Maisonette £104 millions (11.1%)
- Other £75 millions (8.02%)
Tonbridge and Malling Property Market at Postcode Level
| Postcode |
Coverage Area |
School |
Local Authority Area |
| DA13 |
Meopham,Istead Rise,Vigo,Southfleet |
Details |
Dartford, Gravesham, Sevenoaks, Tonbridge and Malling |
| ME1 |
Rochester,Burham,Wouldham |
Details |
Medway, Tonbridge and Malling |
| ME5 |
Walderslade,Blue Bell Hill,Lordswood,Luton |
Details |
Medway (and smaller areas within Maidstone, Tonbridge and Malling) |
| ME6 |
Snodland |
Details |
Tonbridge and Malling |
| ME18 |
Wateringbury,Mereworth,Teston,Nettlestead,West Pec kham,Yalding,Laddingford |
Details |
Maidstone, Tonbridge and Malling |
| ME19 |
West Malling,Kings Hill,Leybourne,East Malling |
Details |
Tonbridge and Malling |
| ME20 |
Aylesford,Ditton,Larkfield,Eccles |
Details |
Tonbridge and Malling |
| TN9 |
Tonbridge |
Details |
Tonbridge and Malling |
| TN10 |
Tonbridge |
Details |
Tonbridge and Malling |
| TN11 |
Penshurst,Hildenborough,Hadlow |
Details |
Sevenoaks, Tonbridge and Malling, Tunbridge Wells |
| TN12 |
Paddock Wood,Staplehurst,Brenchley,Horsmonden,Mard en,East Peckham |
Details |
Maidstone, Tonbridge and Malling, Tunbridge Wells |
| TN15 |
Kemsing,Ightham,Plaxtol,Wrotham,Sevenoaks Weald |
Details |
Sevenoaks, Tonbridge and Malling |
Month-wise Break-up of Total Sales
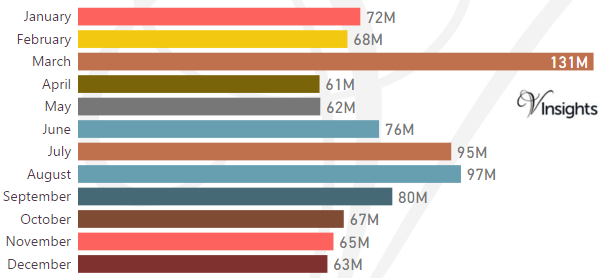
Some of the insights based on the £938 millions month-wise break-down :
Stamp Duty Hike Impact
- March had property sale spike of £131 millions compared to £68 millions in Feb
- The impetus for it was to avoid the extra 3% in Stamp Duty Tax applicable on buying an additional home, being applicable from April 1 2016
Brexit Impact
- Brexit took place on 23rd June 2016.
- Year on Year growth has been 4% in 2016 over 2015
- Brexit coupled with Stamp Duty Hike did not have negative impact and there was good growth in Tonbridge and Malling Property Market in 2016
Total No Of Properties Sold By Property Type
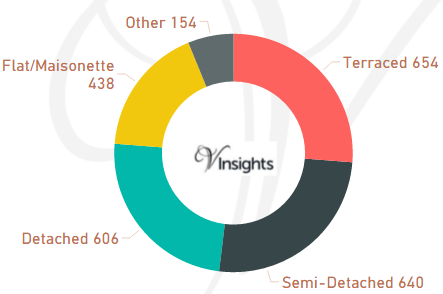
Tonbridge and Malling had total property sales of 2492.The split across different property types are:
- Terraced 654 (26.24%)
- Semi-Detached 640 (25.68%)
- Detached 606 (24.32%)
- Flat/Maisonette 438 (17.58%)
- Other 154 (6.18%)
Average & Median Sales Price
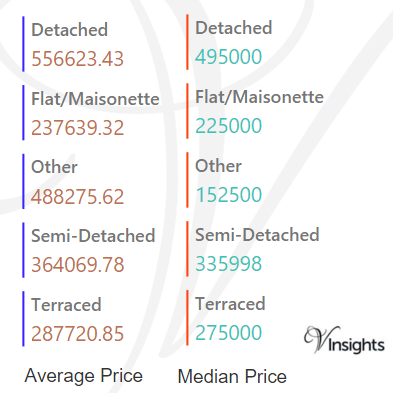
The average sales price in Tonbridge and Malling was £376 K and for different property types it was:
- Detached £557 K
- Semi-Detached £364 K
- Terraced £288 K
- Flat/Maisonette £238 K
- Other it is £488 K
Similarly median sales price in Tonbridge and Malling was £320 K and for different property types are:
- Detached £495 K
- Semi-Detached £336 K
- Terraced £275 K
- Flat/Maisonette £225 K
- Other it is £153 K
New Vs Not New Property Statistics
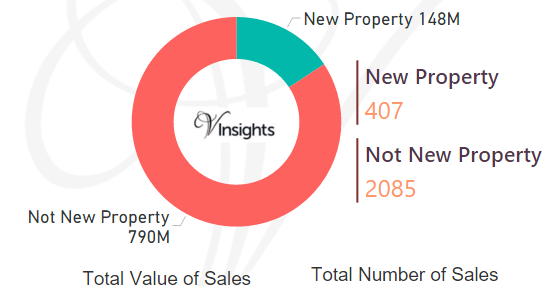
By Sales Value the split is as follows:
- New Property contributed £148 millions (15.74%)
- Not New Property contributed £790 millions (84.26%)
By Total Number the split is as follows:
- New properties sold were 407 (16.33%)
- Not new property sold were 2,085 (83.67%)
All Kent Posts
6f3fe653-e18d-41b4-a5f1-3f5b5f3bcdf9|0|.0|27604f05-86ad-47ef-9e05-950bb762570c
Story Highlights
- Canterbury had total property sales of £911 millions in 2016
- The total number of properties sold in 2016 was 2801
- The average sales price in Canterbury was £325 K, whereas the median was £265 K
- New Property sales were 3.39% by value, whereas Not New Property contributed 96.61%.
- Stamp duty changes caused monthly spike in March
- Brexit coupled with Stamp Duty changes did not have negative impact, there was strong growth of 7.68%
Canterbury is one of the districts of Kent.
Total Sales By Property Type
Canterbury had total property sales of £911 millions which was 9.77% of the total Kent Property Market 2016
The split £911 millions across the different property types are:
- Detached £326 millions (35.8%)
- Semi-Detached £205 millions (22.4%)
- Terraced £176 millions (19.36%)
- Flat/Maisonette £102 millions (11.19%)
- Other £102 millions (11.18%)
Canterbury Property Market at Postcode Level
| Postcode |
Coverage Area |
School |
Local Authority Area |
| CT1 |
Canterbury(south and city centre) |
Details |
Canterbury |
| CT2 |
Canterbury(north),Harbledown,Rough Common,Sturry,F ordwich,Blean,Tyler Hill,Broad Oak,Westbere |
Details |
Canterbury |
| CT3 |
Wingham |
Details |
Canterbury,Dover |
| CT4 |
Chartham,Bridge |
Details |
Canterbury,Ashford |
| CT5 |
Whitstable,Seasalter,Tankerton,Chestfield,Swalecli ffe,Yorkletts |
Details |
Canterbury |
| CT6 |
Herne Bay,Herne,Broomfield,Greenhill,Eddington,Bel tinge,Reculver |
Details |
Canterbury |
Month-wise Break-up of Total Sales
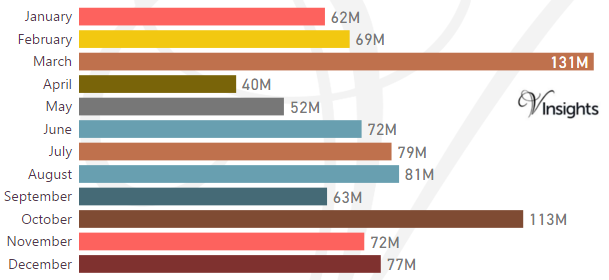
Some of the insights based on the £911 millions month-wise break-down :
Stamp Duty Hike Impact
- March had property sale spike of £131 millions compared to £69 millions in Feb
- The impetus for it was to avoid the extra 3% in Stamp Duty Tax applicable on buying an additional home, being applicable from April 1 2016
Brexit Impact
- Brexit took place on 23rd June 2016.
- Year on Year growth has been 7.68% in 2016 over 2015
- Brexit coupled with Stamp Duty Hike did not have negative impact and there was robust growth
Total No Of Properties Sold By Property Type
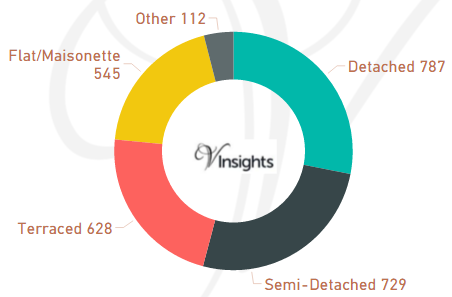
Canterbury had total property sales of 2801. The split across different property types are:
- Detached 787 (28.1%)
- Semi-Detached 729 (26.03%)
- Terraced 628 (22.42%)
- Flat/Maisonette 545 (19.46%)
- Other 112 (4%)
Average & Median Sales Price
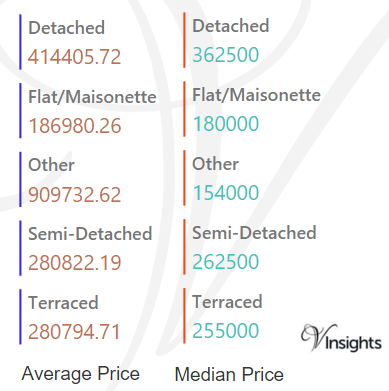
The average sales price in Canterbury was £325 K and for different property types it was:
- Detached £414 K
- Semi-Detached £281 K
- Terraced £281 K
- Flat/Maisonette £187 K
- Other it is £910 K
Similarly median sales price in Canterbury was £265 K and for different property types are:
- Detached £363 K
- Semi-Detached £263 K
- Terraced £255 K
- Flat/Maisonette £180 K
- Other it is £154 K
New Vs Not New Property Statistics
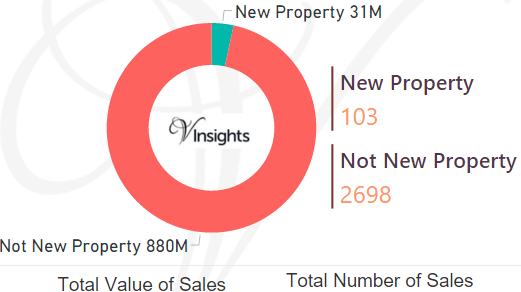
By Sales Value the split is as follows:
- New Property contributed £31 millions (3.39%)
- Not New Property contributed £880 millions (96.61%)
By Total Number the split is as follows:
- New properties sold were 103 (3.68%)
- Not new property sold were 2,698 (96.32%)
All Kent Posts
21765508-6ef3-442e-9c17-29d7e894b67f|0|.0|27604f05-86ad-47ef-9e05-950bb762570c