Story Highlights
- Hounslow had total Property Sales of £1.86 billions in 2016
- The total number of properties sold in year 2016 was 3072
- The average property price was £607 K while median was was £380 K
- Not New Property contributed 85.94% and New Property 14.06% by sales value
- Stamp duty changes caused monthly spike in March
- Brexit coupled with Stamp Duty changes caused Hounslow Property Market to stagnate and there was no appreciable change in 2016 compared to 2015
Hounslow is one of the Boroughs of West London. It had total Property Sales of £1.86 billions which was 13.27% of West London Property Market 2016.
Total Sales By Property Type
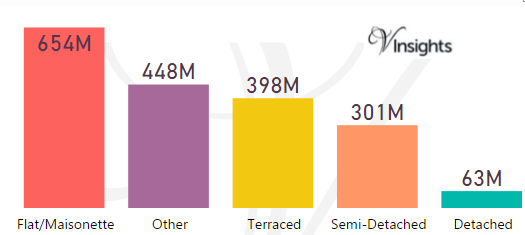
The split of £1.86 billions across the different property types are:
- Flat/Maisonette: £654 millions (35.1%)
- Other: £448 millions (24.03%)
- Terraced: £398 millions (21.37%)
- Semi-Detached: £301 millions (16.15%)
- Detached: £63 millions (3.36%)
Year on Year Comparison : Compared to Hounslow Property Market 2015 in 2016
- All the property types have shown decline in sales except Other
- Others has shown growth of 79.2% in total sales value in 2016 over 2015
- Total sales value has remained fairly constant in 2016 compared to 2015
Hounslow Property Market at Postcode level
| Postcode |
Coverage Area
|
Local Authority Area |
| TW1 |
Twickenham, St. Margarets, Strawberry Hill (east)
|
Hounslow, Richmond upon Thames |
| TW3 |
Hounslow, Lampton, Whitton (north) |
Hounslow, Richmond upon Thames |
| TW4 |
Hounslow West, Hounslow Heath, Whitton (west), Cranford (south) |
Hounslow, Richmond upon Thames |
| TW5 |
Heston, Cranford (north), Osterley (west) |
Hounslow |
| TW7 |
Isleworth, Osterley (east and centre) |
Hounslow,Richmond Upon Thames |
| TW8 |
Brentford, Kew Bridge, Syon Park |
Hounslow, Ealing |
| TW13 |
Feltham, Hanworth |
Hounslow, Richmond upon Thames |
| TW14 |
Feltham (part of the station area), North Feltham, East Bedfont, Hatton |
Hillingdon, Hounslow, Spelthorne |
| TW15 |
Ashford |
Hounslow, Spelthorne |
| UB2 |
Southall (south), Norwood Green |
Ealing, Hounslow |
| W3 |
Acton, West Acton, North Acton (part), South Acton, East Acton (west), Park Royal (south), Hanger Hill Garden Estate, Gunnersbury Park |
Ealing, Hounslow, Hammersmith and Fulham |
| W4 |
Chiswick, Gunnersbury, Turnham Green, Acton Green, South Acton (part), Bedford Park |
Hounslow, Ealing, Hammersmith and Fulham |
| W5 |
Ealing, South Ealing, Ealing Common, North Ealing, Northfields, (south and east), Pitshanger, Hanger Lane |
Ealing, Hounslow |
| W6 |
Hammersmith, Ravenscourt Park, Stamford Brook (part) |
Hammersmith and Fulham, Hounslow |
Month-wise Break-up of Total Sales
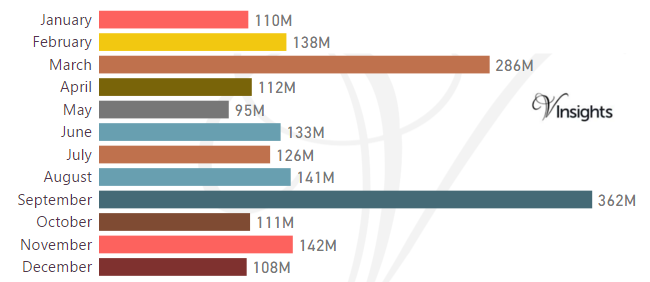
Stamp Duty Hike Impact
- March had property sale spike of £286 millions compared to £138 millions in Feb
- The impetus for it was to avoid the extra 3% in Stamp Duty Tax applicable on buying an additional home, being applicable from April 1 2016
Brexit Impact
- Brexit took place on 23rd June 2016.
- As can be observed from the month-wise break-up there does not seem to have been dip in property sales in the immediate aftermath of Brexit
- Year on Year the property market for Hounslow has remained fairly constant in 2016 over 2015
Total No Of Properties Sold By Property Type
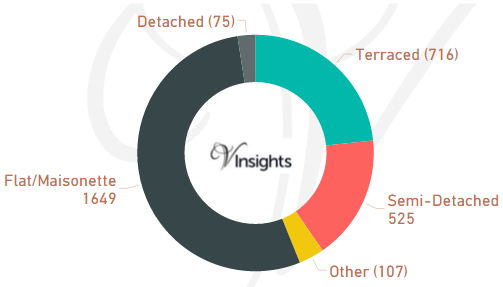
In Hounslow the total number of properties sold in year 2016 was 3072. The breakdown by different property types are:
- Terraced: 716 (23.31%)
- Semi-Detached: 525 (17.09%)
- Other : 107 (3.48%)
- Flat/Maisonette:1649 (53.68%)
- Detached : 75 (2.44%).
Year on Year Comparison : Compared to Hounslow Property Market 2015 in 2016
- Total number of property sales in West London has declined by 14.76%
- All property types have shown decline in number of properties sold except property type Other
- Other has shown significant growth of 18.9%
Average & Median Sales Pric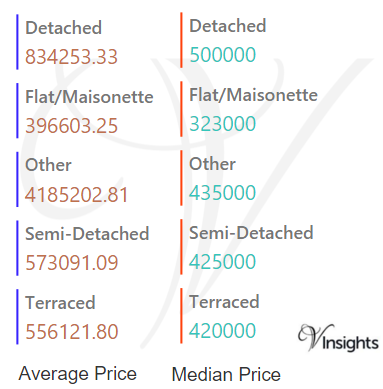
In 2016 the Average property price was £607 K in Hounslow. The average price for the different property types are:
- Detached £834 K
- Flat/Maisonette £396 K
- Other £4.19 millions
- Semi-Detached £573 K
- Terraced £556 K
The Median property price was £380 K. The median property price for the different property types are:
- Detached £500 K
- Flat/Maisonette £323 K
- Other £435 K
- Semi-Detached £425 K
- Terraced £420 K
Year on Year Comparison : Compared to Hounslow Property Market 2015 in 2016
- The average sales price for all property types have gone up except for Detached, Semi-Detached
- The median sales price for all property types have gone up except for Detached, Other
New Vs Not New Property Statistics
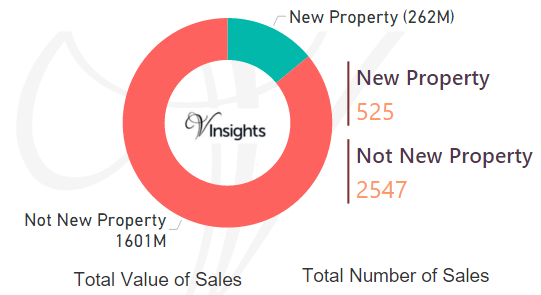
By Value Of Sales
- Not New Property contributed £1.6 billion (85.94%)
- New Property £262 millions (14.06%)
By Number Of Sales
- The number of Not New Property sold was 2547 (82.91%)
- whereas the number of New Properties sold were 525 (17.09%)
Year on Year Comparison : Compared to Hounslow Property Market 2015 in 2016
- New property market share in property market has not shown appreciable change in 2016 over 2015
All London Posts
e47afba4-cc3c-4400-8e39-5f2ed0ce1fbb|0|.0|27604f05-86ad-47ef-9e05-950bb762570c