Story Highlights
- Bristol had total property sales of £2.44 Billions in 2015
- The total number of properties sold in 2015 was 8479
- The average sales price in Bristol was £288 K, whereas median was £215 K
- New Property sales were 5.52% by value, whereas Not New Property contributed 94.48%
Bristol is an unitary authority council in South West England.
Total Value of Sales By Property Types
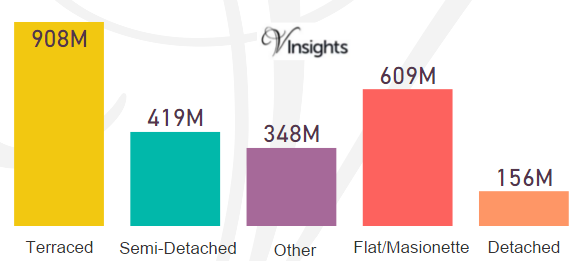
Bristol had total property sales of £2.44 Billions which was 8.24% of South West property Market in 2015.
The split across the different property types in Bristol was:
- Terraced £908 millions (37.21%)
- Semi-Detached £419 millions (17.18%)
- Other £348 millions (14.26%)
- Flat/Maisonette £609 millions (24.97%)
- Detached £156 millions (6.38%)
Total Number of Sales By Property Types
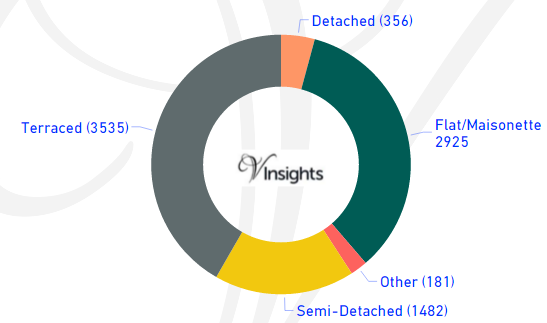
The total property sales of £2.44 Billions in 2015 was spread over 8479 properties.
- Terraced properties was 3,535 (41.69%)
- Detached 356 (4.2%)
- Semi-Detached 1,482 (17.48%)
- Flat/Maisonette 2,925 (34.5%)
- Others 181 (2.13%)
Average & Median Sales Price
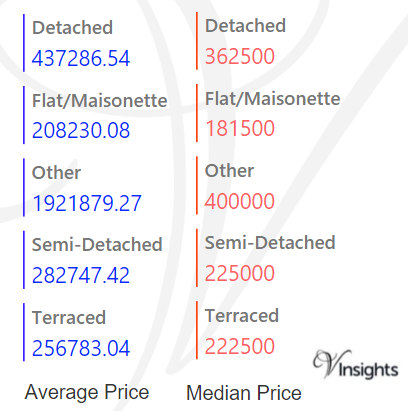
The average sales price in Bristol was £288 K and for the different property types it was:
- Detached £437 K
- Semi-Detached £283 K
- Terraced £257 K
- Flat/Maisonette £208 K
- Other it is £1.92 million
Similarly median sales price in Bristol was £215 K and for different property types it was:
- Detached £363 K
- Semi-Detached £225 K
- Terraced £223 K
- Flat/Maisonette £182 K
- Other it is £400 k
New Vs Not New Property Statistics
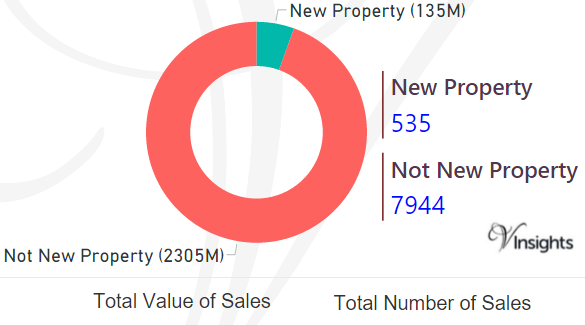
By Sales Values the split is as follows:
- New Property contributed £135 millions (5.52%)
- Not New Property contributed £2.31 billions (94.48%)
By Total Number the split is as follows:
- New properties sold were 535 (6.31%)
- Not new property sold were 7,944 (93.69%)
All England Posts
0cf2da62-2ca7-45c8-a97a-b6138d32da0c|0|.0|27604f05-86ad-47ef-9e05-950bb762570c
Story Highlights
- Bournemouth had total property sales of £1.14 Billions in 2015
- The total number of properties sold in 2015 was 4,393 properties
- The average sales price in Bournemouth was £259 K, whereas median was £220 K
- New Property sales were 6.49% by value, whereas Not New Property contributed 93.51%
Bournemouth is an unitary authority council in South West England.
Total Value of Sales By Property Types
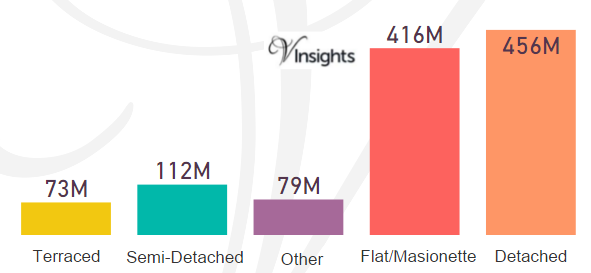
Bournemouth had total property sales of £1.14 Billions which was 3.84% of South West property Market in 2015.
The split across the different property types in Bournemouth was:
- Terraced £73 millions (6.41%)
- Semi-Detached £112 millions (9.9%)
- Other £79 millions (6.98%)
- Flat/Maisonette £416 millions (36.57%)
- Detached £456 millions (40.14%)
Total Number of Sales By Property Types
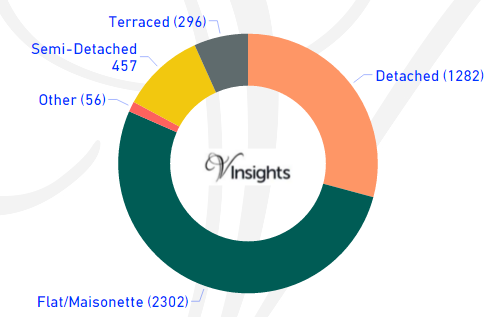
Bournemouth had total property sales of 4,393. The split across the different property types are:
- Detached 1282 (29.18%)
- Flat/Maisonette 2302(52.4%)
- Other 56 (1.27%)
- Semi-Detached 457 (10.4%)
- Terraced 296 (6.74%)
Average & Median Sales Price
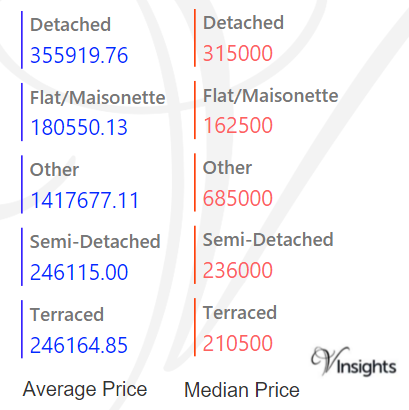
The average sales price in Bournemouth was £259 K and for the different property types it was:
- Detached £356 K
- Semi-Detached £246 K
- Terraced £246 K
- Flat/Maisonette £181 K
- Other it is £1.42 million
Similarly median sales price in Bournemouth was £220 K and for different property types are:
- Detached £315 K
- Semi-Detached £236 K
- Terraced £211 K
- Flat/Maisonette £163 K
- Other it is £685 k
New Vs Not New Property Statistics
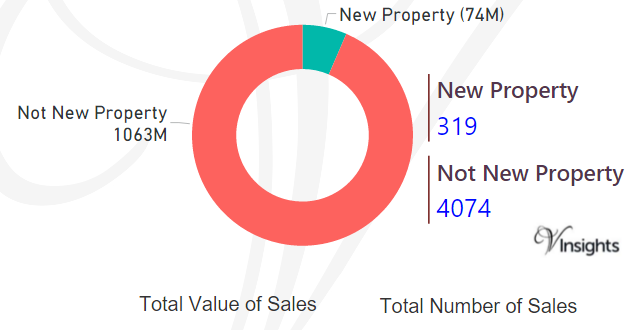
By Sales Values the split is as follows:
- New Property contributed £74 millions (6.49%)
- Not New Property contributed £1.06 billions (93.51%)
By Total Number the split is as follows:
- New properties sold were 319 (7.26%)
- Not new property sold were 4,074 (92.74%)
All England Posts
010df8f0-eaa7-4f22-a9b6-53f94b5e2c99|0|.0|27604f05-86ad-47ef-9e05-950bb762570c
Story Highlights
- Bath and North East Somerset had total property sales of £1.2 Billions in 2015
- The total number of properties sold in 2015 was 3,557 properties
- The average sales price in Bath and North East Somerset was £338 K, whereas median was £268 K
- New Property sales were 10.67% by value, whereas Not New Property contributed 89.33%
Bath and North East Somerset is an unitary authority council in South West England
Total Value of Sales By Property Types
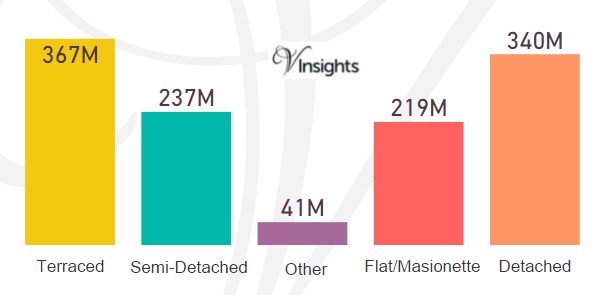
Bath and North East Somerset had total property sales of £1.2 Billions which was 4.06% of the of the total South West property Market in 2015.
The split across the different property types in Bath and North East Somerset are:
- Terraced £367 millions (30.49%)
- Semi-Detached £237 millions (19.69%)
- Other £41 millions (3.41%)
- Flat/Maisonette £219 millions (28.21%)
- Detached £340 millions (28.21%)
Total Number of Sales By Property Types
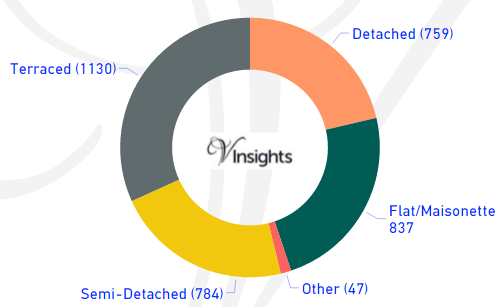
Bath and North East Somerset had total property sales of 3,557. The split across the different property types are:
- Detached 759 (21.34%)
- Flat/Maisonette 837(23.53%)
- Other 47 (1.32%)
- Semi-Detached 784 (22.04%)
- Terraced 1130 (31.77%)
Average & Median Sales Price
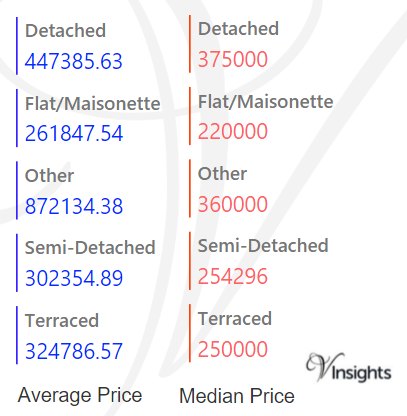
The average sales price in Bath and North East Somerset was £338 K and for the different property types it was:
- Detached £447 K
- Semi-Detached £302 K
- Terraced £325 K
- Flat/Maisonette £262 K
- Other it is £872 K
Similarly median sales price in Bath and North East Somerset was £268 K and for the different property types it was:
- Detached £375 K
- Semi-Detached £254 K
- Terraced £250 K
- Flat/Maisonette £220 K
- Other it is £360 K
New Vs Not New Property Statistics
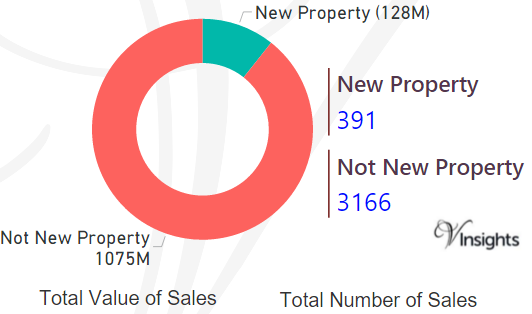
By Sales Values the split is as follows:
- New Property contributed £128 millions (10.67%)
- Not New Property contributed £1.08 billions (89.33%)
By Total Number the split is as follows:
- New properties sold were 391 (10.99%)
- Not new property sold were 3,166(89.01%)
All England Posts
99124f66-04f3-4f5a-a847-c05488ae3209|0|.0|27604f05-86ad-47ef-9e05-950bb762570c

For 2016 details - England and Wales Property Market 2016
Story Highlights
- England and Wales had total property sales of approx. £295 billions in 2015
- The total number of properties sold in 2015 was 99,8376
- The maximum sales was in Greater London at £82 billions
- The average sales price in England and Wales was £295.69, whereas median was £205 K
- The average price was maximum in Greater London at £636 K and median at 399 K
- New Property sales were 10.57% by value where as Not New Property contributed 89.43%
England and Wales property market 2015 is as below. The regions it is made up of are Greater London, South East England, East of England, South West England, North West England , West Midlands, East Midlands, Yorkshire and the Humber, Wales, North East England.
Total Sales By Regions
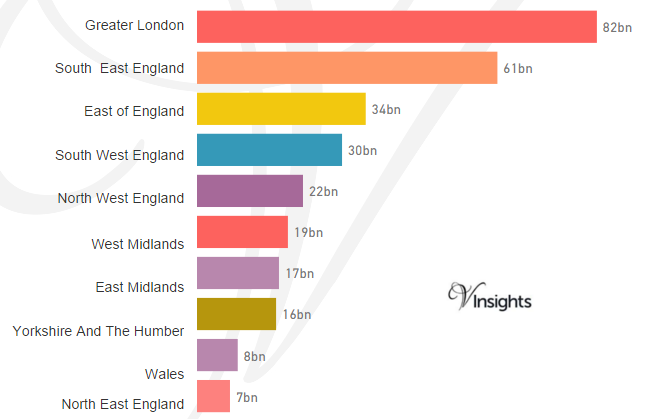
The total property sales of England and Wales combined was approx. £295 billions.
Region wise split of England and Wales property market 2015 is :
Total Sales By Property Type
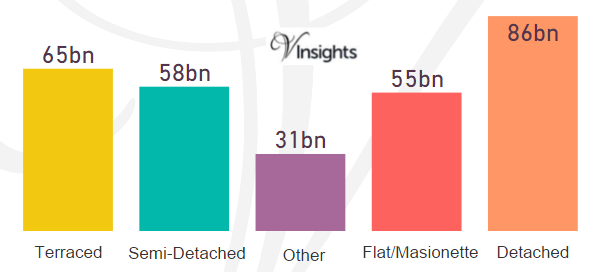
The split of £295 billions across the different property types are
- Terraced at £65 billions (22.02%),
- Semi-Detached at £58 billions (19.58%),
- Other at £31 billions (10.47%),
- Flat/Maisonette at £55 billions (18.78%),
- Detached at £86 billions (29.15%).
Total No Of Properties Sold By Property Type
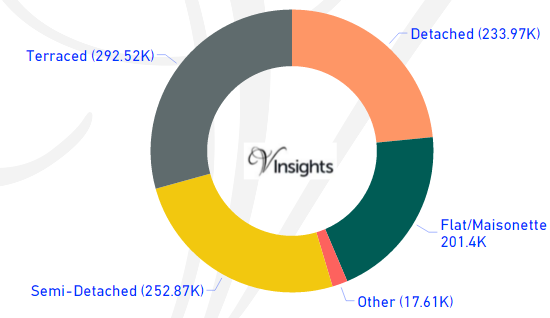
England and Wales had total property sales of 998,376.
The split across the different property types are
- Detached are 233,968 (23.43%)
- Flat/Maisonette at 201,401 (20.17%)
- Other at 17,614 (1.76%),
- Semi-Detached at 252,871 (25.33%)
- Terraced at 292,522 (29.3%).
Average & Median Sales Price
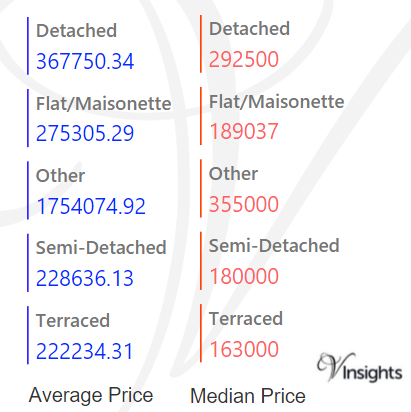
The average sales price in England and Wales was £295.69 K.
For the different property types it was:
- Detached at £368 K,
- Semi-Detached at £229 K,
- Terraced at £222 K,
- Flat/Maisonette at £275 K
- Other it is at £1.75 million.
Similarly median sales price in England and Wales was £205 K.
For different property types it was:
- Detached at £293 K,
- Semi-Detached at £180 K,
- Terraced at £163 K,
- Flat/Maisonette at £189 K
- Other it is at £355 k.
Average and Median Sales Price By Regions
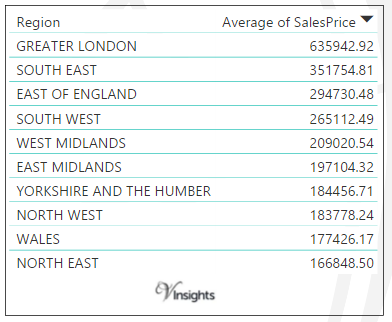
The average sales price by region in England and Wales are :
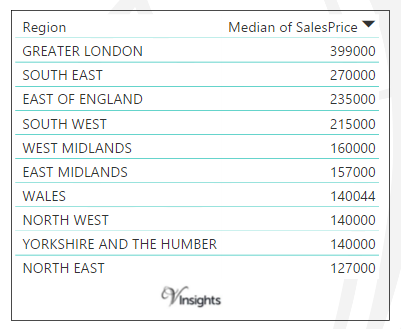
The median sales price by region in England and Wales are :
New Vs Not New Property Statistics
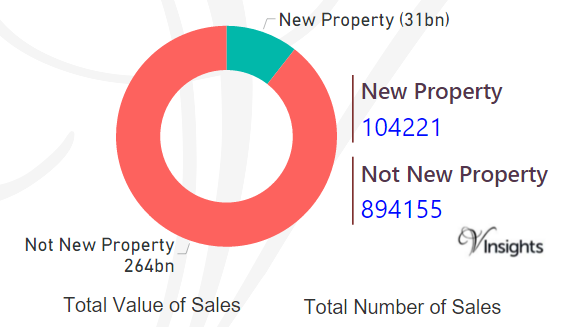
By Sales Value
- Sales value contributed by New Property was £31 billions (10.57%)
- where as Not New Property contribute £264 billions (89.43%).
By Number Of Sales
- New properties sold were 104,221 (10.44%)
- where as not new property sold were 894,155 (89.56%).
All England Posts
e7ea82ea-2517-4860-97a5-1ed838f87105|0|.0|27604f05-86ad-47ef-9e05-950bb762570c
Story Highlights
- West Sussex had total property sales of £5.94 Billions in 2015
- The total number of properties sold in 2015 was 17,856.
- The average sales price in West Sussex was £332.89 K, whereas median was £276 K
- Across its districts average sales price in West Sussex was maximum for Chichester at £411 K and was minimum for Worthing at £272 K
- Similarly the median sales price in West Sussex was maximum for Horsham at £340 K and was minimum for Arun at £244.5 K
- New Property sales were 13.52% by value, whereas Not New Property contributed 86.48%
West Sussex is one of the counties of South East England. The districts of West Sussex are Mid Sussex, Horsham, Arun, Chichester, Worthing, Crawley, Adur. Let us look at the West Sussex Property Market in 2015 in detail.
Total Sales By Districts
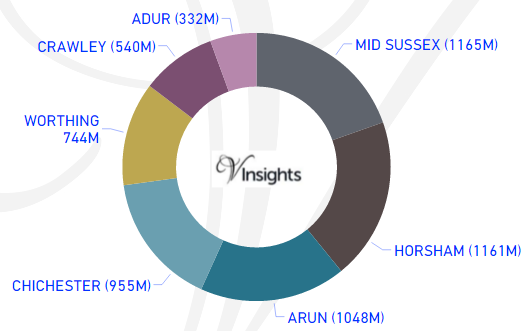
West Sussex had total property sales of £5.94 Billions which was 7.63% of the total South East property Market in 2015.
The split of the sales across the different districts was:
- Mid Sussex £1.165 billions (19.6%)
- Horsham £1.16 billions (19.52%)
- Arun £1.048 billions (17.64%)
- Chichester £955 millions (16.06%)
- Worthing £744 millions (12.51%)
- Crawley £540 millions (9.08%)
- Adur £332 millions (5.59%)
Total Sales By Property Type
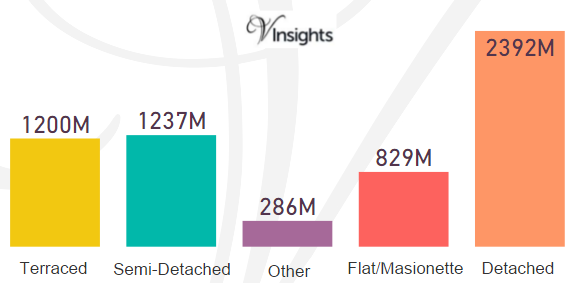
The split across the different property types in West Sussex are:
- Terraced £1.2 billions (20.18%)
- Semi-Detached £1.24 billions (20.81%)
- Other £286 millions (4.82%)
- Flat/Maisonette £829 millions (13.95%)
- Detached £2.4 billions (40.25%)
Total No Of Properties Sold By Property Type
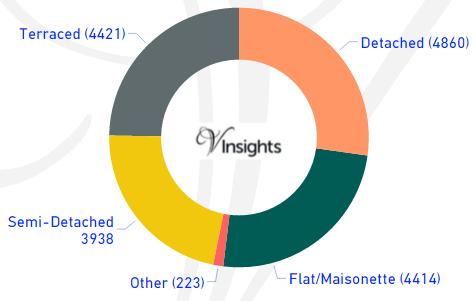
The total property sales of £5.94 Billions 2015 was spread over 17,856 properties.
- Terraced properties was 4,421 (24.76%)
- Detached 4,860 (27.22%)
- Semi-Detached 3,938 (22.05%)
- Flat/Maisonette 4,414 (24.72%)
- Others 223 (1.25%)
Average & Median Sales Price
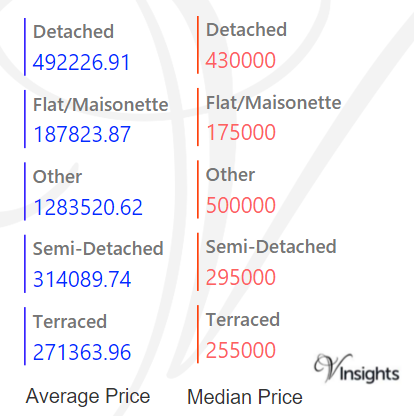
The average sales price in West Sussex was £332.89 K and for the different property types it was:
- Detached £492 K
- Semi-Detached £314 K
- Terraced £271 K
- Flat/Maisonette £188 K
- Other it is £1.28 millions
Similarly median sales price in West Sussex was £276 K and for different property types are:
- Detached £430 K
- Semi-Detached £295 K
- Terraced £255 K
- Flat/Maisonette £175 K
- Other it is £500 K
Average & Median Sales Price By Districts
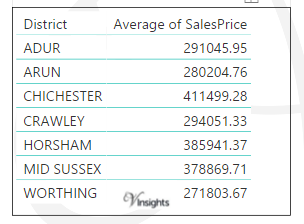
Across districts the average price is as above.
- The maximum was for Chichester at £411 K
- Horsham £386 K
- Mid Sussex £379 K
- Crawley £294 K
- Adur £291 K
- Arun £280 K
- Minimum for Worthing at £272 K
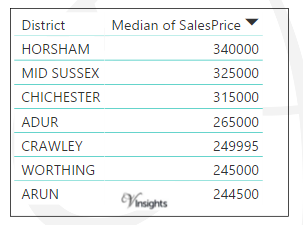
Across districts the median price is as above.
- The maximum was for Horsham at £340 K
- Mid Sussex at £325 K
- Chichester £315 K
- Adur £265 K
- Crawley £250 K
- Worthing £245 K
- Minimum for Arun at £244.5 K
New Vs Not New Property Statistics
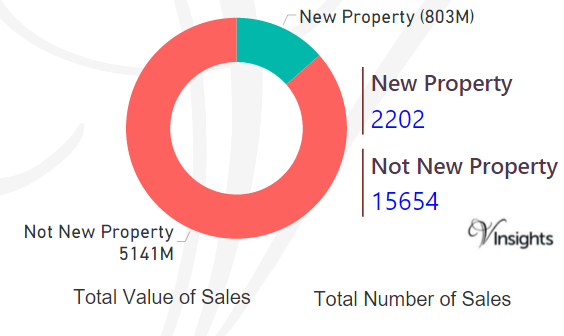
By Sales Values the split is as follows:
- New Property contributed £803 millions (13.52%)
- Not New Property contributed £5.1 billions (86.48%)
By Total Number the split is as follows:
- New properties sold were 2,202 (12.33%)
- Not new property sold were 15,654 (87.67%)
All West Sussex Posts
977088d3-e301-4a56-ad3e-a9e125f86672|0|.0|27604f05-86ad-47ef-9e05-950bb762570c