
Story Highlights
- Wales had total property sales of £8.67 Billions in 2016
- Total Sales By Principal Area was maximum in Cardiff at £1.5 Billions
- The total number of properties sold in 2016 was 47,959 properties
- The average sales price in Wales was £181 K, whereas median was £145 K
- The average sales price in Wales at Principal Area level was max for Monmouthshire £276 K
- New Property sales were 7.28% by value, whereas Not New Property contributed 92.72%
- Stamp duty hike caused monthly spike in March
- Brexit coupled with Stamp Duty Hike did not have negative impact on Wales property Market 2016.
Total Sales By County
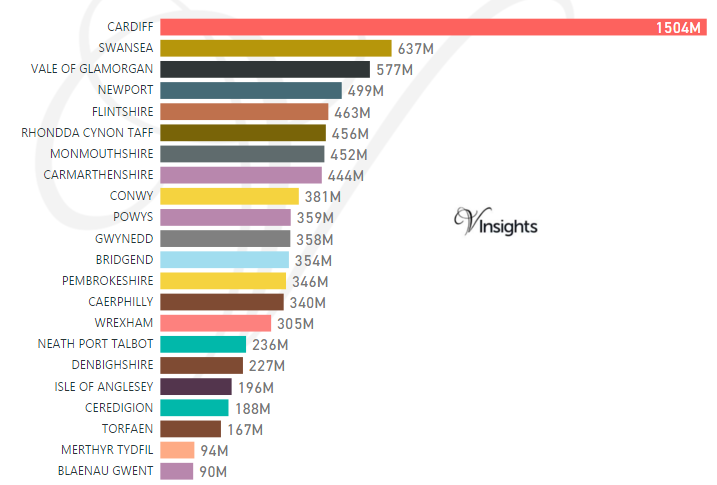
Wales had total property sales of £8.67 Billions. It contributed 2.92% of the England and Wales Property Market 2016.
The split of £8.67 Billions across its principal areas is as below :
- Cardiff £1.5 Billion (17.35%)
- Swansea £637 millions (7.34%)
- Vale Of Glamorgan £577 millions (6.65%)
- NewPort £499 millions (5.76%)
- Flintshire £463 millions (5.33%)
- Rhondda Cynon Taff £456 millions (5.25%)
- Monmouthshire £452 millions (5.21%)
- Carmarthenshire £444 millions (5.13%)
- Conwy £381 millions (4.4%)
- Powys £359 millions (4.14%)
- Gwynedd £358 millions (4.13%)
- Bridgend £354 millions (4.08%)
- Pembrokeshire £346 millions (3.99%)
- Caerphilly £340 millions (3.92%)
- Wrexham £305 millions (3.52%)
- Neath Port Talbot £236 millions (2.72%)
- Denbighshire £227 millions (2.62%)
- Isle Of Anglesey £196 millions (2.26%)
- Ceredigion £188 millions (2.16%)
- Torfaen £167 millions (1.92%)
- Merthyr Tydfil £94 millions (1.08%)
- Blaenau Gwent £90 millions (1.04%)
Year on Year Comparison : Compared to Wales Property Market All Principal Areas 2015 in 2016
Total Value of Sales By Property Types
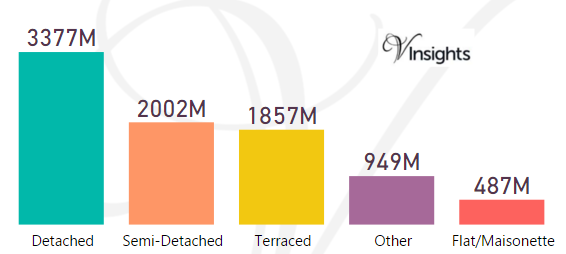
The total sales value of £8.67 billion split by property types in Wales 2016 was:
- Detached £3.38 billions (38.94%)
- Semi-Detached £2 billions (23.08%)
- Terraced £1.86 billions (21.42%)
- Other £949 millions (10.94%)
- Flat/Maisonette £487 millions (5.62%)
Year on Year Comparison : Compared to Wales Property Market 2015 in 2016
- All the property types sales have shown growth over 2015
Month-wise Break-up of Total Sales
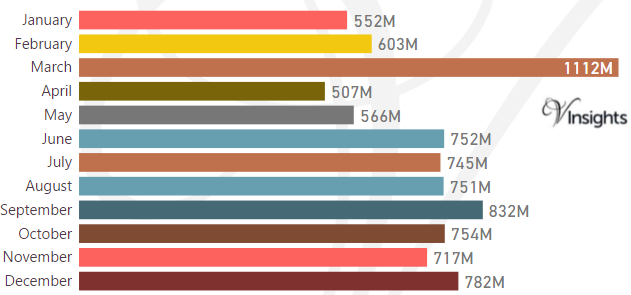
Some of the insights based on the £8.67 billion month-wise break-down :
Stamp Duty Hike Impact
- March had property sale spike of £1.11 billions compared to £603 millions in Feb
- The impetus for it was to avoid the extra 3% in Stamp Duty Tax applicable on buying an additional home, being applicable from April 1 2016
Brexit Impact
- Brexit took place on 23rd June 2016.
- As can be observed from the month-wise break-up there does not seem to have been dip in property sales in the immediate aftermath of Brexit
- Year on Year growth has been 3.58% so there was no negative Brexit Impact
Total Number of Sales By Property Types
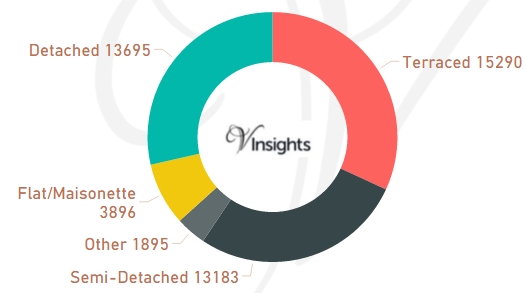
The total number of property transactions in Wales 2016 was 47,959
- Terraced 15,290 (31.88%)
- Detached 13,695 (28.56%)
- Semi-Detached 13,183 (27.49%)
- Flat/Maisonette 3,896 (8.12%)
- Other 1,895 (3.95%)
Year on Year Comparison : Compared to Wales Property Market 2015 in 2016
- All property types had growth in number of properties sold
- Other had significant growth of 139%
Average & Median Sales Price
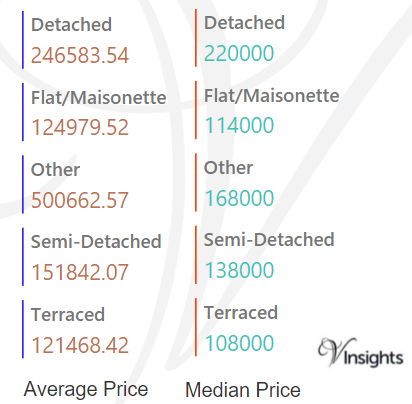
The average sales price in Wales was £181 K. For the different property types it was:
- Detached at £247 K
- Semi-Detached at £152 K
- Terraced at £122 K
- Flat/Maisonette at £125 K
- Other it is at £501 K
The median sales price in Wales was £145 K. For the different property types it was:
- Detached at £220 K
- Semi-Detached at £138 K
- Terraced at £108 K
- Flat/Maisonette at £114 K
- Other it is at £168 K
Year on Year Comparison : Compared to Wales Property Market 2015 in 2016
- All property type had increase in average and median sales price except Other
Average & Median Sales Price By County
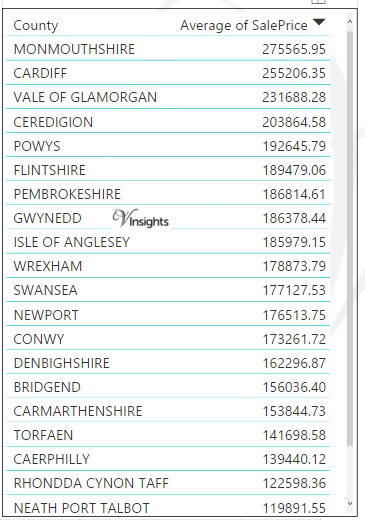
The average sales price by county in Wales by Principal Areas in 2016 was:
- Monmouthshire £276 K
- Cardiff £255 K
- Vale Of Glamorgan £232 K
- Ceredigion £204 K
- Powys £193 K
- Flintshire £190 K
- Pembrokeshire £187 K
- Gwynedd £186 K
- Isle Of Anglesey £186 K
- Wrexham £179 K
- Swansea £177 K
- NewPort £177 K
- Conwy £173 K
- Denbighshire £162 K
- Bridgend £156 K
- Carmarthenshire £154 K
- Torafen £142 K
- Caerphilly £139 K
- Rhondda Cynon Taff £123 K
- Neath Port Talbot £120 K
- Merthyr Tydfil £112 K
- Blaenau Gwent £105 K
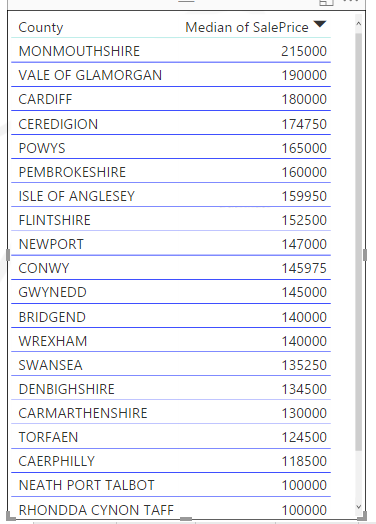
The median sales price by county in Wales by Principal Areas in 2016 was:
- Monmouthshire £215 K
- Vale Of Glamorgan £190 K
- Cardiff £180 K
- Ceredigion £175 K
- Powys £165 K
- Pembrokeshire £160 K
- Isle Of Anglesey £160 K
- Flintshire £153 K
- NewPort £147 K
- Conwy £146 K
- Gwynedd £145 K
- Bridgend £140 K
- Wrexham £140 K
- Swansea £135 K
- Denbighshire £135 K
- Carmarthenshire £130 K
- Torafen £125 K
- Caerphilly £119 K
- Neath Port Talbot £100 K
- Rhondda Cynon Taff £100 K
- Merthyr Tydfil £85 K
- Blaenau Gwent £79 K
Year on Year Comparison : Compared to Wales Property Market All Principal Areas 2015 in 2016
- Average Sales Price has gone up except for Vale Of Glamorgan, Pembrokeshire, Swansea,Neath Port Talbot,Merthyr Tydfil
- Median Sales price has gone up except for Pembrokeshire, Neath Port Talbot, Rhondda Cynon Taff, Merthyr Tydfil
New Vs Not New Property Statistics
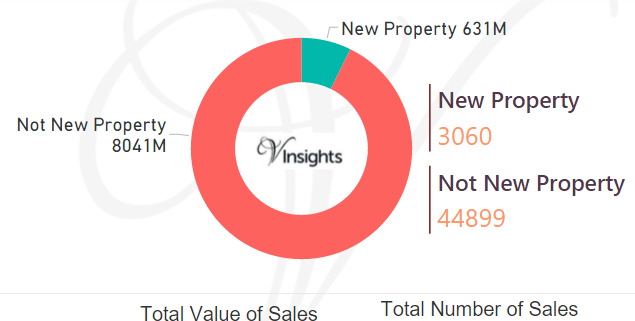
By Sales Value
- Sales value contributed by New Property was £631 millions (7.28%)
- Not New Property contributed £8.04 billions (92.72%).
By Number Of Sales
- New Properties sold were 3,060 (6.38%)
- Not New Properties sold were 44,899 (93.62%)
Year on Year Comparison : Compared to Wales Property Market 2015
- New property market share in property market has gone down in 2016 over 2015
All Wales Post

9957a7f9-04c6-433a-9e8b-44ef8342f308|0|.0|27604f05-86ad-47ef-9e05-950bb762570c