Story Highlights
- Cambridgeshire had total property sales of £3.5 Billions in 2015
- The total number of properties sold in 2015 was 11,395 properties
- The average sales price in Cambridgeshire was £308 K whereas median was £248 K
- Across its districts average sales price in Cambridgeshire was maximum for Cambridge at £514 K and was minimum for Fenland £173 K
- Similarly the median sales price in Cambridgeshire was maximum for Cambridge at £400 K and was minimum for Fenland £147 K
- New Property sales were 11.94% by value where as Not New Property contributed 88.06%
Total Sales By Districts
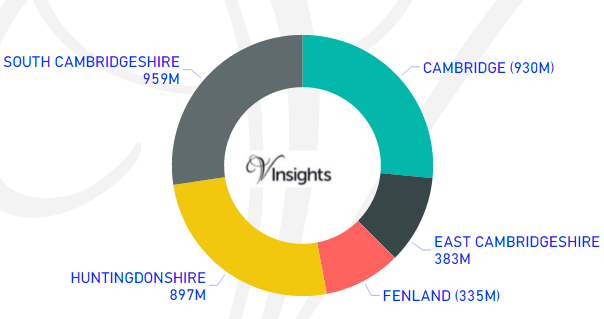
Cambridgeshire had total property sales of £3.5 Billions which was 10.17% of the total East of England property market 2015.
The split of the sales across the different districts was:
- South Cambridgeshire £959 millions (27.37%)
- Cambridge £930 millions (26.55%)
- Huntingdonshire £897 millions (25.6% )
- East Cambridgeshire £383 millions (10.93%)
- Fenland 335 millions (9.55%).
Total Sales By Property Type
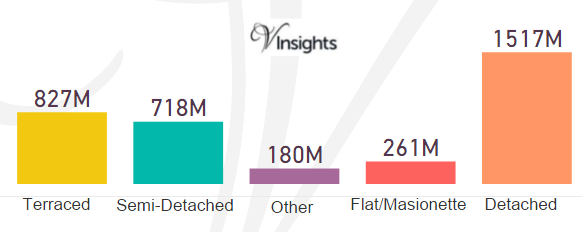
The split of £3.5 Billions across the different property types in Cambridgeshire are:
- Terraced £827 millions (23.6%)
- Semi-Detached £718 millions (20.5%)
- Other £180 millions (5.15%)
- Flat/Maisonette £261 millions (7.46%)
- Detached £1.52 billions (43.29%).
Total No Of Properties Sold By Property Type
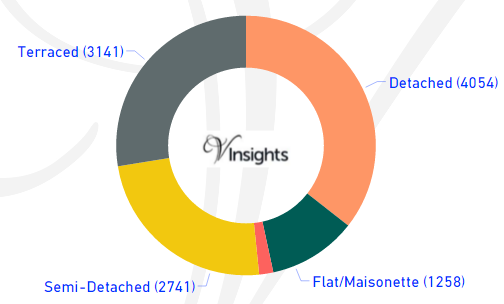
The total property sales of £3.5 Billions in 2015 was spread over 11,395 properties.
- Terraced properties was 3,141 (27.56%)
- Detached 4,054 (35.58%)
- Semi-Detached 2,741 (24.05%)
- Flat/Maisonette 1,258 (11.04%)
- Others 201 (1.76%).
Average & Median Sales Price
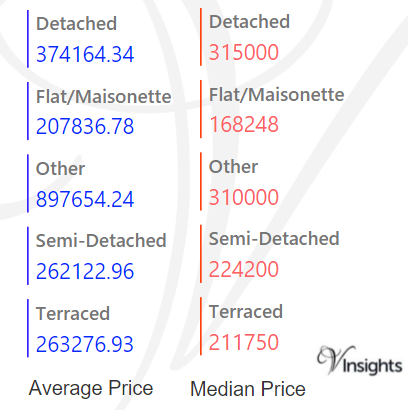
The average sales price in Cambridgeshire was £308 K.For the different property types it was:
- Detached £374 K
- Semi-Detached £262 K
- Terraced £263 K
- Flat/Maisonette £208 K
- Other it is £898 K.
Similarly median sales price in Cambridgeshire was £248 K.For different property types are:
- Detached £315 K
- Semi-Detached £224 K
- Terraced £212 K
- Flat/Maisonette £168 K
- Other it is £310 K.
Average & Median Sales Price By Districts
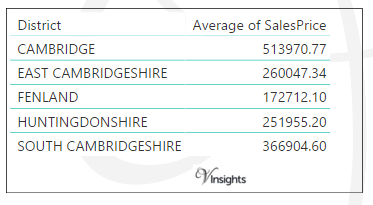
The average of sales price at district level in Cambridgeshire, in 2015 is as above.
- The maximum average of sales price is in Cambridge at £514 K
- South Cambridgeshire £367 K
- East Cambridgeshire £260 K
- Huntingdonshire £252 K
- With minimum for Fenland at £173 K.
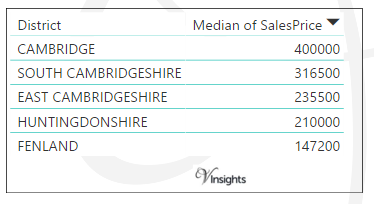
The median of sales price at district level in Cambridgeshire, in 2015 is as above.
- The maximum median of sales price is in Cambridge at £400 K
- South Cambridgeshire £317 K
- East Cambridgeshire £236 K
- Huntingdonshire £210 K
- With minimum for Fenland at £147 K.
New Vs Not New Property Statistics
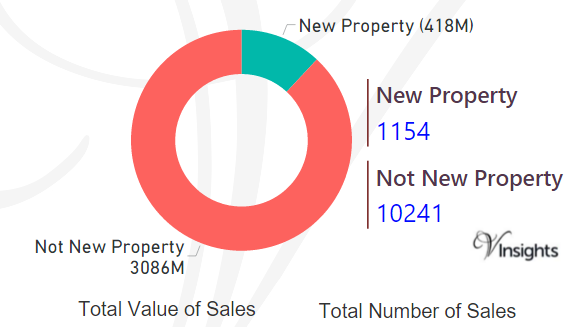
By Sales Values the split is as follows:
- New Property was £418 millions (11.94%)
- Not New Property contributed £3.09 billions (88.06%).
By Total Number the split is as follows:
- New properties sold were 1,154 (10.13%)
- Not new property sold were 10,241(89.87%).
All Cambridgeshire Posts

e3659f6e-14c2-4d52-ad95-db0b5406466f|0|.0|27604f05-86ad-47ef-9e05-950bb762570c
For 2016 details -Bedford Property Market 2016
Story Highlights
- Bedford had total property sales of £852 millions in 2015
- The total number of properties sold in 2015 was 3,324
- The average sales price in Bedford was £256 K whereas median was £225 K
- New Property sales were 18.88% by value where as Not New Property contributed 81.12%
Total Sales By Property Type
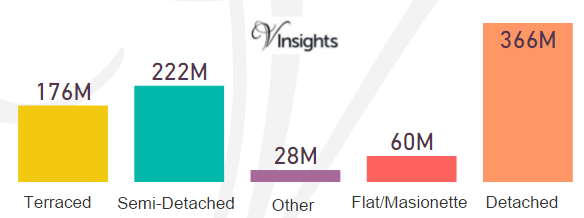
Bedford had total property sales of £852 millions which was 2.47% of East England Property market.
The split across the different property types are:
- Terraced 176 millions (20.68%)
- Semi-Detached 222 millions (26.02%)
- Other 28 millions (3.28%)
- Flat/Maisonette 60 millions (7.07%)
- Detached 366 millions (42.95%).
Total No Of Properties Sold By Property Type
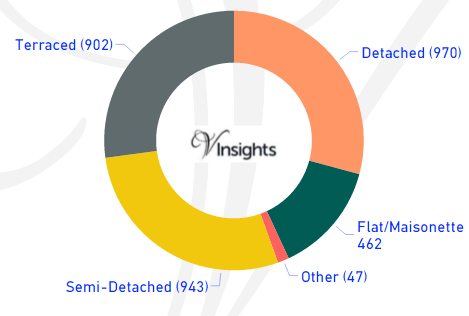
The total property sales of £852 millions in 2015 was spread over 3,324 properties.
- Terraced properties was 902 (27.14%)
- Detached 970 (29.18%)
- Semi-Detached 943 (28.37%)
- Flat/Maisonette 462 (13.9%)
- Others 47 (1.41%).
Average & Median Sales Price
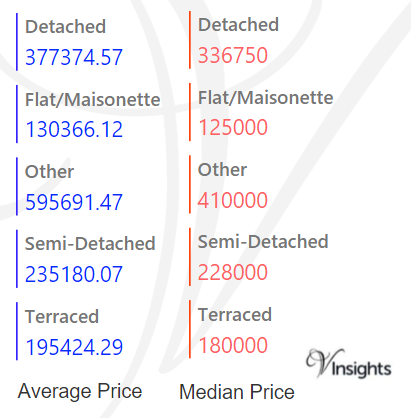
The average sales price in Bedford was £256 K.For the different property types it was:
- Detached £377 K
- Semi-Detached £235 K
- Terraced £195 K
- Flat/Maisonette £130 K
- Other it is £596 K.
Similarly median sales price in Bedford was £225 K.For different property types are:
- Detached £337 K
- Semi-Detached £228 K
- Terraced £180 K
- Flat/Maisonette £125 K
- Other it is £410 K.
New Vs Not New Property Statistics
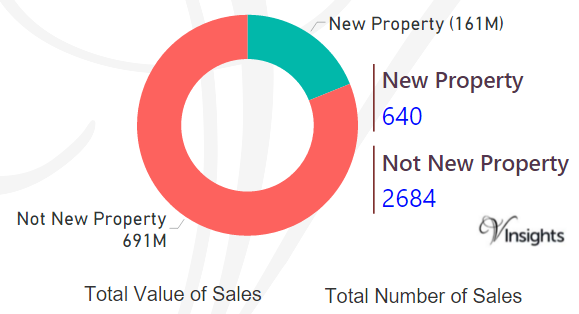
By Sales Values the split is as follows:
- New Property was £161 millions (18.88%)
- Not New Property contributed £691 millions (81.12%).
By Total Number the split is as follows:
- New properties sold were 640 (19.25%)
- Not new property sold were 2,684 (80.75%).
All East of England Posts
26376dac-b57b-498e-8384-5ae90f575e6a|0|.0|27604f05-86ad-47ef-9e05-950bb762570c
For 2016 Details : Wiltshire Property Market 2016 at Postcode Level with School Details
Story Highlights
- Wiltshire had total property sales of £2.64 Billions in 2015
- The total number of properties sold in 2015 was 9,376
- The average sales price in Wiltshire was £282 K, whereas median was £230 K
- New Property sales were 12.92% by value, whereas Not New Property contributed 87.08%
Wiltshire is a county in South West England
Total Value of Sales By Property Types
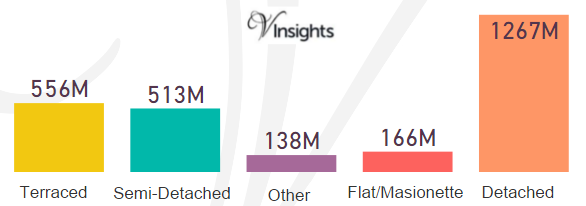
Wiltshire had total property sales of £2.64 Billions which was 8.91% of the total South West property Market in 2015.
The split across the different property types in Wiltshire are:
- Terraced £556 millions (21.06%)
- Semi-Detached £513 millions (19.44%)
- Other £138 millions (5.23%)
- Flat/Maisonette £166 millions (6.27%)
- Detached £1.27 Billions (48%)
Total Number of Sales By Property Types
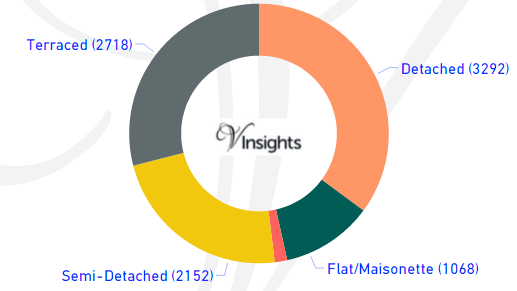
Wiltshire had total property sales of 9,376. The split across the different property types are:
- Detached 3,292 (35.11%)
- Flat/Maisonette 1,068 (11.39%)
- Other 146 (1.56%)
- Semi-Detached 2,152 (22.95%)
- Terraced 2,718 (28.99%)
Average & Median Sales Price
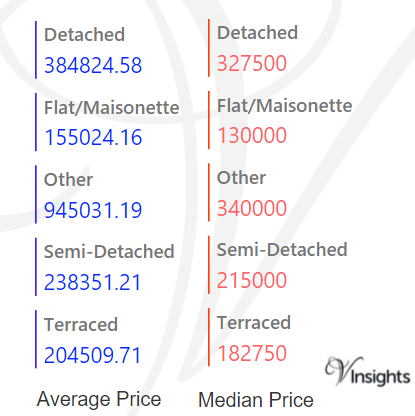
The average sales price in Wiltshire was £282 K and for the different property types it was:
- Detached £385 K
- Semi-Detached £238 K
- Terraced £205 K
- Flat/Maisonette £155 K
- Other it is £945 K
Similarly median sales price in Wiltshire was £230 K and for the different property types it was:
- Detached £328 K
- Semi-Detached £215 K
- Terraced £183 K
- Flat/Maisonette £130 K
- Other it is £340 K
New Vs Not New Property Statistics
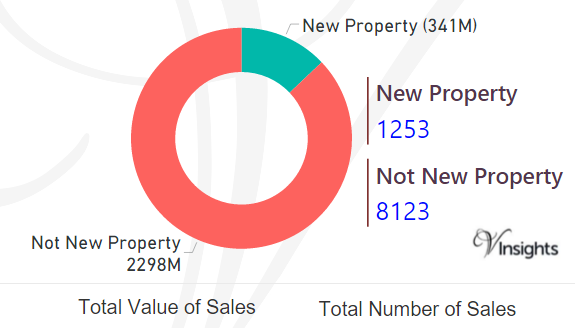
By Sales Values the split is as follows:
- New Property contributed £341 millions (12.92%)
- Not New Property contributed £2.3 billions (87.08%)
By Total Number the split is as follows:
- New properties sold were 1,253 (13.36%)
- Not new property sold were 8,123 (86.64%)
All South West England Posts
5bced8c9-4629-4a3b-b7cf-d4755b7891df|0|.0|27604f05-86ad-47ef-9e05-950bb762570c
For 2016 Details - Torbay Property Market 2016 at Postcode Level with School Details
Story Highlights
- Torbay had total property sales of £674 millions in 2015
- The total number of properties sold in 2015 was 3,212
- The average sales price in Torbay was £210 K, whereas median was £175 K
- New Property sales were 6.54% by value, whereas Not New Property contributed 93.46%
Torbay is an unitary authority council in South West England
Total Value of Sales By Property Types
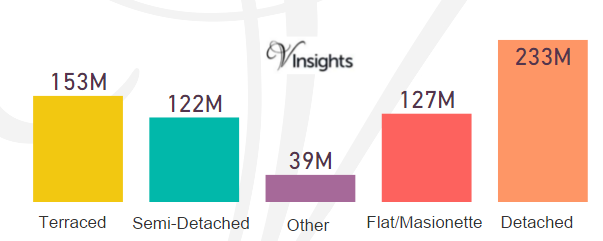
Torbay had total property sales of £674 millions which was 2.28% of the total South West property Market in 2015.
The split across the different property types in Torbay are:
- Terraced £153 millions (22.66%)
- Semi-Detached £122 millions (18.06%)
- Other £39 millions (5.83%)
- Flat/Maisonette £127 millions (18.86%)
- Detached £233 millions (34.58%)
Total Number of Sales By Property Types
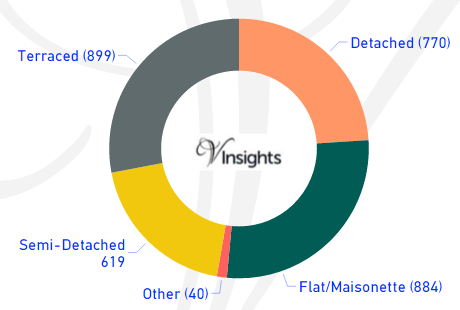
Torbay had total property sales of 3,212. The split across the different property types are:
- Detached 770 (23.97%)
- Flat/Maisonette 884(27.52%)
- Other 40 (1.25%)
- Semi-Detached 619 (19.27%)
- Terraced 899 (27.99%)
Average & Median Sales Price
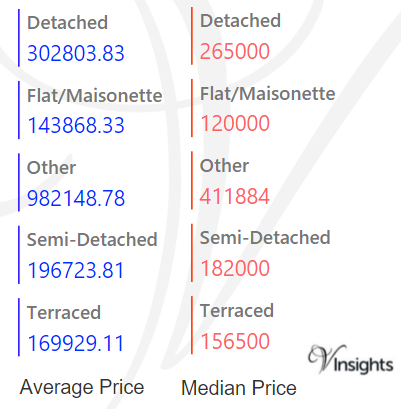
The average sales price in Torbay was £210 K and for the different property types it was:
- Detached £303 K
- Semi-Detached £197 K
- Terraced £170 K
- Flat/Maisonette £144 K
- Other it is £982 K
Similarly median sales price in Torbay was £175 K and for the different property types it was:
- Detached £265 K
- Semi-Detached £182 K
- Terraced £157 K
- Flat/Maisonette £120 K
- Other it is £412 K
New Vs Not New Property Statistics
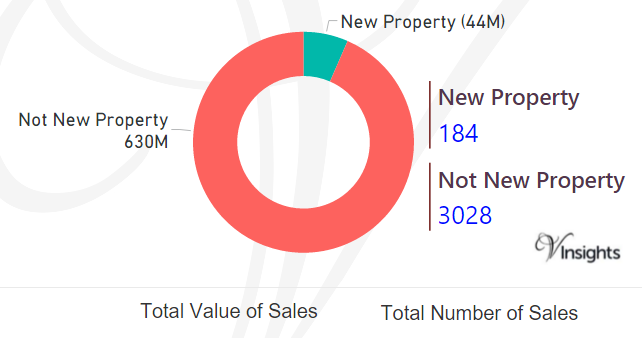
By Sales Values the split is as follows:
- New Property contributed £44 millions (6.54%)
- Not New Property contributed £630 millions (93.46%)
By Total Number the split is as follows:
- New properties sold were 184 (5.73%)
- Not new property sold were 3,028 (94.27%)
All South West England Posts
2ad378cd-bc7d-4637-a51d-a32f166d3e89|0|.0|27604f05-86ad-47ef-9e05-950bb762570c
For 2016 Details : Swindon Property Market 2016 at Postcode Level with School Details
Story Highlights
- Swindon had total property sales of £1.09 Billions in 2015
- The total number of properties sold in 2015 was 4,763
- The average sales price in Swindon was £229 K, whereas median was £179 K
- New Property sales were 12.84% by value, whereas Not New Property contributed 87.16%
Swindon is an unitary authority council in South West England
Total Value of Sales By Property Types
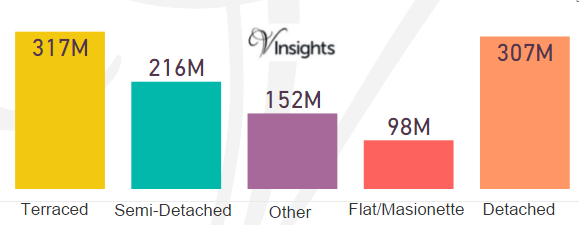
Swindon had total property sales of £1.09 Billions which was 3.68% of the total South West property Market in 2015.
The split across the different property types in Swindon are:
- Terraced £317 millions (29.04%)
- Semi-Detached £216 millions (19.82%)
- Other £152 millions (13.97%)
- Flat/Maisonette £98 millions (9.02%)
- Detached £307 millions (28.15%)
Total Number of Sales By Property Types
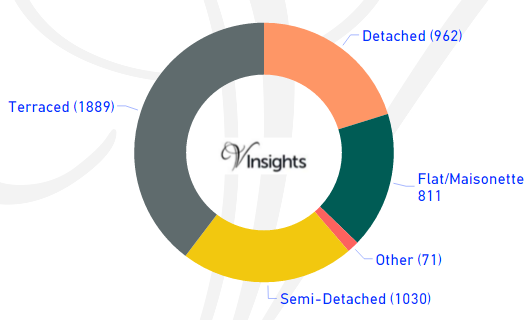
Swindon had total property sales of 4,763. The split across the different property types are:
- Detached 962 (20.2%)
- Flat/Maisonette 811(17.03%)
- Other 71 (1.49%)
- Semi-Detached 1,030 (21.63%)
- Terraced 1,889 (39.66%)
Average & Median Sales Price
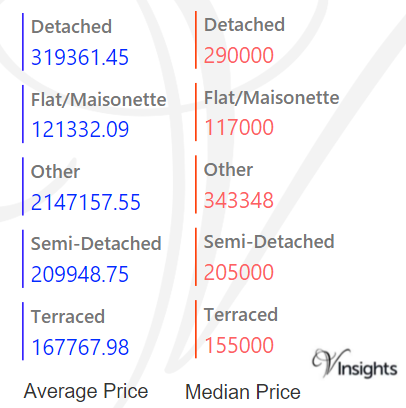
The average sales price in Swindon was £229 K and for the different property types it was:
- Detached £319 K
- Semi-Detached £210 K
- Terraced £168 K
- Flat/Maisonette £121 K
- Other it is £2.15 millions
Similarly median sales price in Swindon was £179 K and for the different property types it was:
- Detached £290 K
- Semi-Detached £205 K
- Terraced £155 K
- Flat/Maisonette £117 K
- Other it is £343 K
New Vs Not New Property Statistics
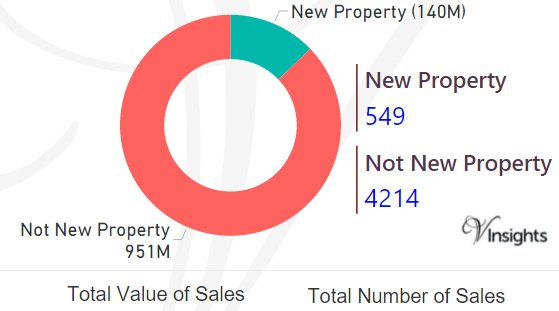
By Sales Values the split is as follows:
- New Property contributed £140 millions (12.84%)
- Not New Property contributed £951 millions (87.16%)
By Total Number the split is as follows:
- New properties sold were 549 (11.53%)
- Not new property sold were 4,214(88.47%)
All South West England Posts
92bccf76-4328-445e-96d7-ee5c57f62e1e|0|.0|27604f05-86ad-47ef-9e05-950bb762570c