Story Highlights
- Medway had total property sales of £1.15 Billion in 2016
- The total number of properties sold in 2016 was 4,822 properties
- The average sales price in Medway was £239 K, whereas the median sales price was £215 K
- New Property sales were 3.63% by value, whereas Not New Property contributed 96.37%
- Stamp duty changes caused monthly spike in March
- Medway had modest growth of 0.9% in 2016 over 2015
Medway has unitary authority status in South East England.
Total Sales By Property Type
Medway had total property sales of £1.15 billion which was 1.85% of the total South East property Market in 2016.
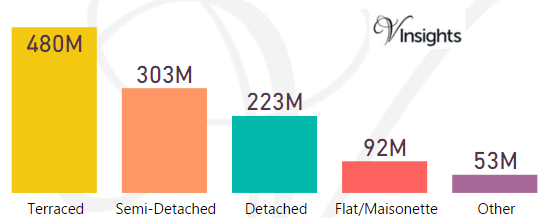
The split of £1.15 billion in Medway across the different property types are:
- Terraced £480 millions (41.7%)
- Semi-Detached £303 millions (26.37%)
- Detached £223 millions (19.38%)
- Flat/Maisonette £92 millions (7.97%)
- Other £53 millions (4.58%)
Year on Year Comparison : Compared to Medway Property Market 2015 in 2016
- All the property types sales have shown growth except Flat/Maisonette and Other.
Medway Property Market at Postcode Level
| Postcode |
Coverage Area |
School |
Local Authority Area |
| ME1 |
Rochester,Burham,Wouldham |
Details |
Medway,Tonbridge and Malling |
| ME2 |
Strood,Halling,Cuxton,Frindsbury |
Details |
Medway |
| ME3 |
Rural,Hoo Peninsula,Higham |
Details |
Medway,Gravesham |
| ME4 |
Chatham |
Details |
Medway |
| ME5 |
Walderslade,Blue Bell Hill,Lordswood,Luton |
Details |
Medway (and smaller areas within Maidstone, Tonbridge and Malling) |
| ME7 |
Gillingham,Rainham,Hempstead |
Details |
Medway |
| ME8 |
Rainham, Parkwood,Twydall |
Details |
Medway |
Month-wise Break-up of Total Sales
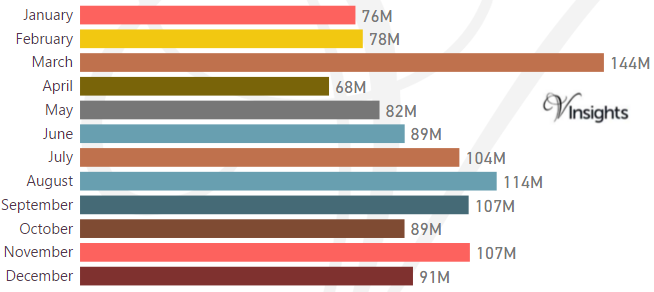
Some of the insights based on the £1.15 billion month-wise break-down :
Stamp Duty Hike Impact
- March had property sale spike of £144 millions compared to £78 millions in Feb
- The impetus for it was to avoid the extra 3% in Stamp Duty Tax applicable on buying an additional home, being applicable from April 1 2016
Brexit Impact
- Brexit took place on 23rd June 2016.
- Year on Year growth (compared to 2015) has been 0.9% in 2016
- Brexit coupled with Stamp Duty Hike have not had negative impact on Medway Property Market in 2016
Total No Of Properties Sold By Property Type
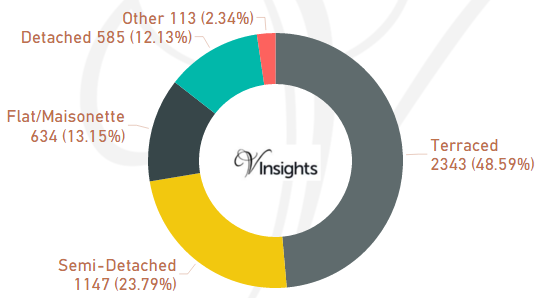
Medway had total property sales of 4,822. The split across different property types are:
- Terraced 2,343 (48.59%)
- Semi-Detached 1,147 (23.79%)
- Flat/Maisonette 634 (13.15%)
- Detached 585 (12.13%)
- Other 113 (2.34%)
Year on Year Comparison : Compared to Medway Property Market 2015 in 2016
- Total number of property sales in 2016 has decreased by 1%.
- All property types have shown decline in number of properties sold except property type Other.
- Other has shown growth of 37.80%
Average & Median Sales Price
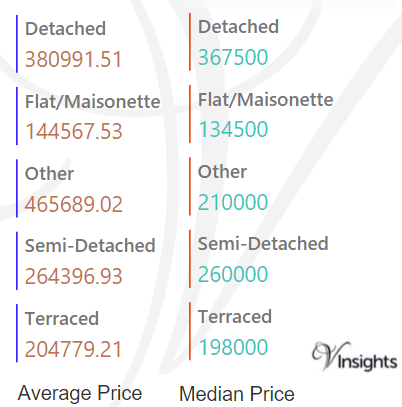
The average sales price in Medway was £239 K. For the different property types it was
- Detached at £381 K
- Semi-Detached at £264 K
- Terraced at £205 K
- Flat/Maisonette at £145 K
- Other it is at £466 K
Similarly median sales price in Medway was £215 K. For different property types it was
- Detached at £368 K
- Semi-Detached at £260 K
- Terraced at £198 K
- Flat/Maisonette at £135 K
- Other it is at £210 K
Year on Year Comparison : Compared to Medway Property Market 2015 in 2016
- The average and median property prices have gone up except for property type Flat/Maisonette, Other.
- Other had massive decline in average and median property price
New Vs Not New Property Statistics
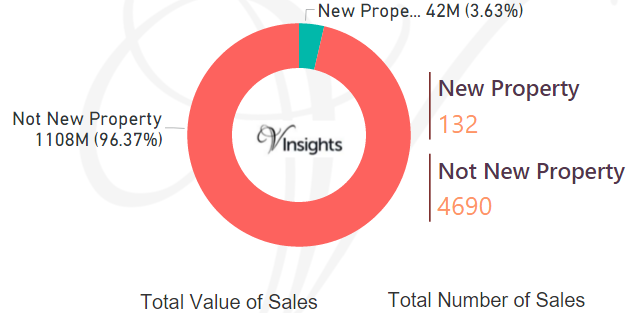
By Sales Value the split is as follows:
- New Property contributed £42 millions (3.63%)
- Not New Property contributed £1.1 billion (96.37%)
By Total Number the split is as follows:
- New properties sold were 132 (2.74%)
- Not new property sold were 4690 (97.26%)
Year on Year Comparison : Compared to Medway Property Market 2015 in 2016
- New property market share in property market has gone down
All South East England Posts

751a3ba2-3913-466e-b49c-ed67971dfa82|0|.0|27604f05-86ad-47ef-9e05-950bb762570c
For 2016 details - Medway Property Market 2016
Story Highlights
- Medway had total property sales of £1.14 Billions in 2015
- The total number of properties sold in 2015 was 5,113 properties
- The average sales price in Medway was £223 K, whereas the median sales price was £190 K
- New Property sales were 8.65% by value, whereas Not New Property contributed 91.35%
Medway has unitary authority status in South East England.
Total Sales By Property Type
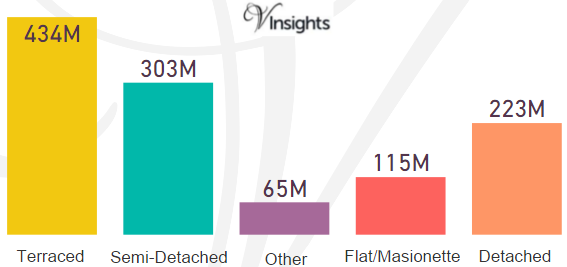
Medway had total property sales of £1.14 Billions which was 1.86% of the total South East property Market in 2015.
The split across the different property types are:
- Terraced £434 millions (38.09%)
- Semi-Detached £303 millions (26.62%)
- Other £65 millions (5.67%)
- Flat/Maisonette £115 millions (10.08%)
- Detached £223 millions (19.54%)
Total No Of Properties Sold By Property Type

Medway had total property sales of 5,113. The split across the different property types are:
- Detached 652 (12.75%)
- Flat/Maisonette 788 (15.41%)
- Other 82 (1.6%)
- Semi-Detached 1,173 (22.94%)
- Terraced 2,418 (47.29%)
Average & Median Sales Price
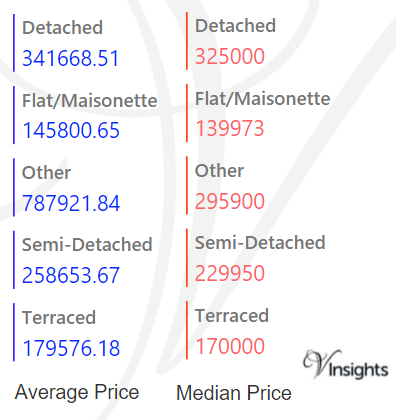
The average sales price in Medway was £223 K and for the different property types it was:
- Detached £342 K
- Semi-Detached £259 K
- Terraced £180 K
- Flat/Maisonette £146 K
- Other it is £788 K
Similarly median sales price in Medway was £190 K and for the different property types it was:
- Detached £325 K
- Semi-Detached £230 K
- Terraced £170 K
- Flat/Maisonette £140 K
- Other it is £296 K
New Vs Not New Property Statistics
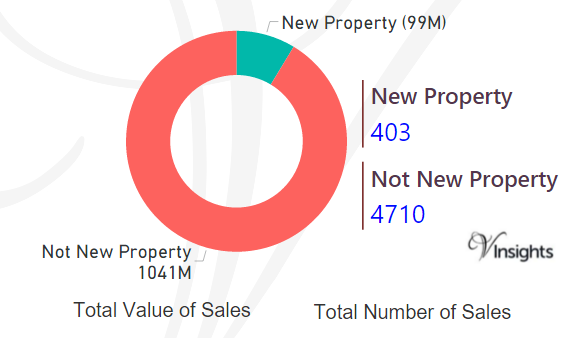
By Sales Values the split is as follows:
- New Property contributed £99 millions (8.65%)
- Not New Property contributed £1.04 billions (91.35 %)
By Total Number the split is as follows:
- New properties sold were 403 (7.88%)
- Not new property sold were 4,710 (92.12%)
All South East England Posts
1e88fc20-82b0-4d88-9711-88163b04bbb9|0|.0|27604f05-86ad-47ef-9e05-950bb762570c