Story Highlights
- Redbridge had total Property Sales of £1.49 billions in 2016
- The total number of properties sold in year 2016 was 3260
- The Average property price was £458 K while Median was £385 K
- Not New Property contributed 97.03% by value and New Property 2.97%
- Stamp duty changes caused monthly spike in March
- Brexit and Stamp Duty changes did not have significant impact on Redbridge property market 2016
Redbridge is one of the Boroughs of East London. It had total Property Sales of £1.49 billions which was 9.09% of East London Property Market 2016.
Total Sales By Property Type
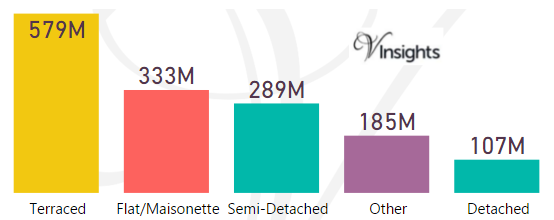
The split of £1.49 billions across the different property types are:
- Terraced £579 millions (38.8%)
- Flat/Maisonette £333 millions (22.72%)
- Semi-Detached £289 millions (19.36%)
- Other £185 millions (12.39%)
- Detached £107 millions (7.19%).
Year on Year Comparison : Compared to Redbridge Property Market 2015 in 2016
- All the property types have shown decline in sales except Flat/Maisonette, Other.
- Others has shown significant growth of about 172% year on year
Redbridge Property Market at Postcode Level
| Postcode |
Coverage Area
|
Local Authority Area |
| E11 |
Leytonstone district: Leytonstone, Wanstead, Aldersbrook (part), Snaresbrook, Cann Hall
|
Waltham Forest, Redbridge |
| E12 |
Manor Park district: Manor Park, Little Ilford, Aldersbrook (part) |
Newham, Redbridge,Barking and Dagenham |
| E18 |
Woodford and South Woodford district: Woodford, South Woodford |
Redbridge |
| IG1 |
Ilford, Cranbrook, Loxford |
Redbridge |
| IG2 |
Gants Hill, Newbury Park, Aldborough Hatch |
Redbridge |
| IG3 |
Seven Kings, Goodmayes |
Redbridge |
| IG4 |
Redbridge |
Redbridge |
| IG5 |
Clayhall |
Redbridge |
| IG6 |
Barkingside, Fullwell Cross, Hainault (south), Fairlop |
Redbridge |
| IG7 |
Chigwell, Chigwell Row, Hainault (north) |
Epping Forest, Redbridge |
| IG8 |
Woodford Green, Woodford Bridge, Highams Park (part) |
Redbridge, Waltham Forest |
| IG9 |
Buckhurst Hill |
Epping Forest, Redbridge |
| IG11 |
Barking, Creekmouth |
Barking and Dagenham, Redbridge |
| RM6 |
Chadwell Heath, Marks Gate, Little Heath, Goodmayes (north), Hainault (South)
|
Barking and Dagenham, Redbridge, Havering |
| RM8 |
Dagenham, Becontree, Becontree Heath, Chadwell Heath
|
Barking and Dagenham, Redbridge |
| RM9 |
Dagenham, Becontree Castle Green |
Barking and Dagenham, Redbridge, Havering |
For property market details at post code level please click on Postcode in the table above.
Month-wise Break-up of Total Sales
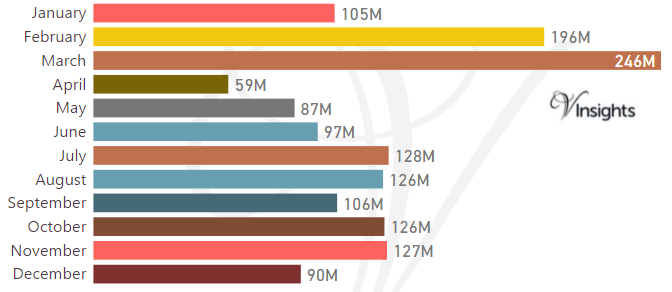
Stamp Duty Hike Impact
- March had property sale spike of £246 millions compared to £ 196 millions in Feb
- The impetus for it was to avoid the extra 3% in Stamp Duty Tax applicable on buying an additional home, being applicable from April 1 2016
Brexit Impact
- Brexit took place on 23rd June 2016.
- As can be observed from the month-wise break-up there does not seem to have been dip in property sales in the immediate aftermath of Brexit
- Year on Year the property market for Redbridge has shown growth of 3.5% over 2015
Total No Of Properties Sold By Property Type
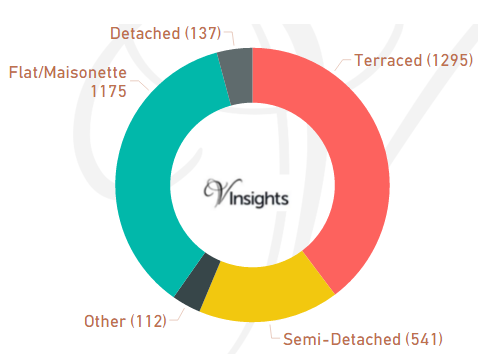
In Redbridge the total number of properties sold in year 2016 was 3260. The breakdown by different property types are:
- Terraced 1295 (39.72%)
- Semi-Detached 541 (16.6%)
- Other 112 (3.44%)
- Flat/Maisonette 1175 (36.04%)
- Detached 137 (4.2%).
Year on Year Comparison : Compared to Redbridge Property Market 2015 in 2016
- Total number of property sales in Redbrdige has declined by 11.03%
- All property types have shown decline in number of properties sold except Other
- Other has shown significant increase of 111%.
Average & Median Sales Price
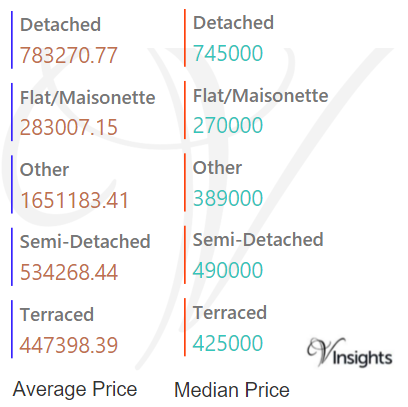
In 2016 the Average property price was £458 K in Redbridge. The average price for the different property types are:
- Detached £783 K
- Flat/Maisonette £283 K
- Other £1.65 millions
- Semi-Detached £534 K
- Terraced £447 K.
The Median Price was £385 K. The median property price for the different property types are:
- Detached £745 K
- Flat/Maisonette £270 K
- Other £389 K
- Semi-Detached £490 K
- Terraced £425 K.
Year on Year Comparison : Compared to Redbridge Property Market 2015 in 2016
- The average and median sales price across all property types have gone up except for Other
- Other decline indicates that property for business/commercial purpose became cheaper in 2016 compared to 2015
New Vs Not New Property Statistics
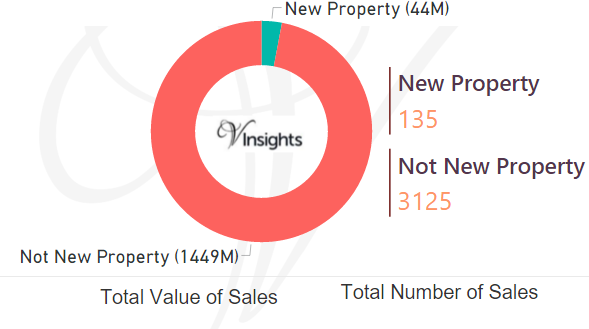
By Value Of Sales
- Not New Property contributed £1.5 billion (97.03%)
- New Property £44 millions (2.97%)
By Number Of Sales
- The number of Not New Property sold was 3125 (95.86%)
- The number of New Properties sold was 135 (4.14%)
Year on Year Comparison : Compared to Redbridge Property Market 2015 in 2016
- New property market share in property market has gone down in 2016 over 2015
All London Posts
128f45f1-1785-4c37-a326-a781448427f6|0|.0|27604f05-86ad-47ef-9e05-950bb762570c