For 2016 details - Newham Property Market 2016
Story Highlights
- Newham had total Property Sales of £1.2 billions in 2015.
- The total number of properties sold in year 2015 was 3434.
- The Average property price was £348 K while Median was £305 K.
- Not New Property Contributed 84.89% by value and New Property 15.11%
Total Sales By Property Type
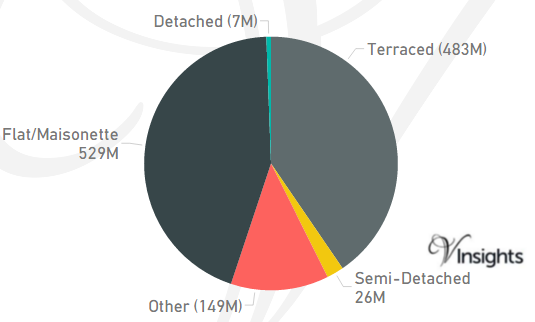
Newham is one of the Boroughs of East London. It had total Property Sales of £1.2 billions which was 7.3% of East London Property Market 2015.
The split across the different property types are:
- Terraced £483 millions (40.46%)
- Semi-Detached £26 millions (2.17%)
- Other £149 millions (12.48%)
- Flat/Maisonette £529 millions (44.3%)
- Detached £7 millions (0.59%).
Total No Of Properties Sold By Property Type
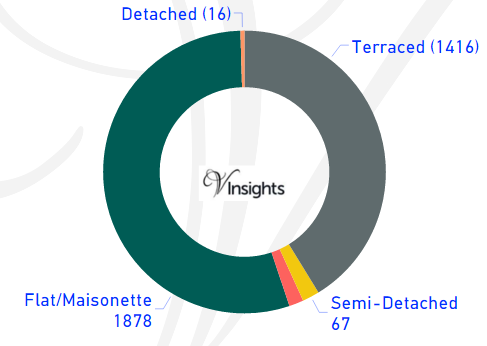
In Newham the total number of properties sold in year 2015 was 3434. The breakdown by different property types are:
- Terraced 1416 (41.23%)
- Semi-Detached 67 (1.95%)
- Other 57 (1.66%)
- Flat/Maisonette 1878 (54.69%)
- Detached 16 (0.47%).
Average & Median Sales Price
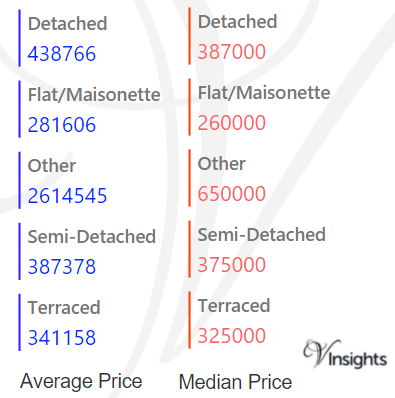
In 2015 the Average property price was £348 K in Newham. The average price for the different property types are:
- Detached £439 K
- Flat/Maisonette £282 K
- Other £2.6 millions
- Semi-Detached £387 K
- Terraced £341 K.
The Median Price was £305 K. The median property price for the different property types are:
- Detached £387 K
- Flat/Maisonette £260 K
- Other £650 K
- Semi-Detached £375 K
- Terraced £325 K.
New Vs Not New Property Statistics
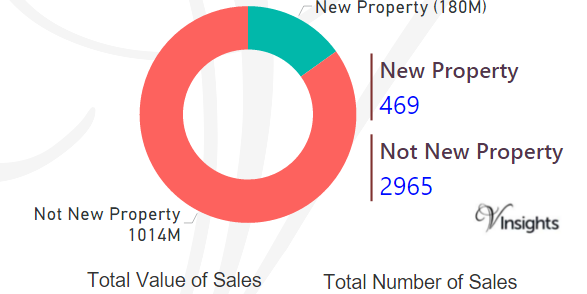
By Value Of Sales
- Not New Property contributed £1.01 billion (84.89%)
- New Property 180 millions (15.11%) giving combined total of £1.2 billions.
By Number Of Sales
- The number of Not New Property sold was 2965 (86.34%)
- The number of New Properties sold was 469 (13.66%) giving combined total of 3434.
All London Posts
3726dad9-1a31-4293-995d-f56738a55937|0|.0|27604f05-86ad-47ef-9e05-950bb762570c