Story Highlights
- Barking and Dagenham in 2016 had total property sales of £753 millions.
- The total number of properties sold in year 2016 was 2390
- The Average property price was £315 K while median was £287 K
- Not New Property Contributed 92.12% and New Property 7.88% by sales value
- Stamp duty changes caused monthly spike in March
- Brexit coupled with Stamp duty changes has not impacted the property market, total sales has shown growth of 4.7%
Barking and Dagenham is one of the boroughs of East London.
Total Sales By Property Type
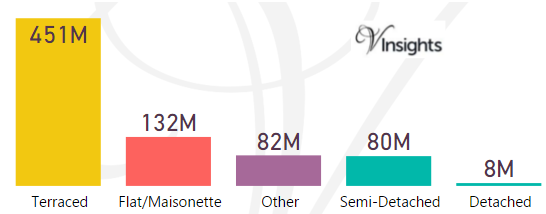
Barking And Dagenham is one of the boroughs of East London. It had property sales of £753 millions which was 4.59% of East London Property Market in 2016.
The breakdown of £753 millions by different property in Barking And Dagenham was:
- Terraced £451 millions (59.94%)
- Detached £7.6 millions (1%)
- Flat/Maisonette £132 millions (17.5%)
- Other £82 millions (10.92%)
- Semi-Detached £80 millions (10.64%).
Year on Year Comparison : Compared to Barking And Dagenham Property Market 2015 in 2016
- Barking And Dagenham as a whole had property sales by value increase of 4.72 %
- Only property type Other has shown decline i.e. 21.2 %
Barking And Dagenham Property Market at Postcode Level
| Postcode |
Coverage Area
|
Local Authority Area |
| E12 |
Manor Park district: Manor Park, Little Ilford, Aldersbrook (part) |
Newham, Redbridge, Barking and Dagenham |
| IG11 |
Barking, Creekmouth |
Barking and Dagenham |
| RM6 |
Chadwell Heath, Marks Gate, Little Heath, Goodmayes (north), Hainault (South) |
Barking and Dagenham, Redbridge, Havering |
| RM7 |
Rush Green, Mawneys, Romford |
Havering, Barking and Dagenham |
| RM8 |
Dagenham, Becontree, Becontree Heath, Chadwell Heath |
Barking and Dagenham, Redbridge |
| RM9 |
Dagenham, Becontree Castle Green |
Barking and Dagenham, Redbridge, Havering |
| RM10 |
Dagenham, Becontree |
Barking and Dagenham |
For property market details at post code level please click on Postcode in the table above.
Month-wise Break-up of Total Sales
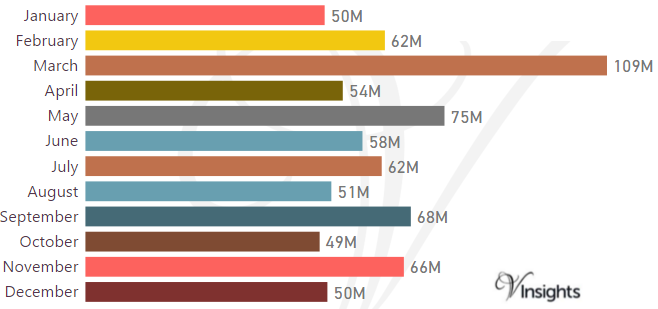
Stamp Duty Hike Impact
- March had property sale spike of £109 millions compared to £62 millions in Feb
- The impetus for it was to avoid the extra 3% in Stamp Duty Tax applicable on buying an additional home, being applicable from April 1 2016
Brexit Impact
- Brexit took place on 23rd June 2016.
- As can be observed from the month-wise break-up there does not seem to have been any dip in property sales in the immediate aftermath of Brexit
- Year on Year the property market by sales value has shown growth of 4.72%
Total No Of Properties Sold By Property Type
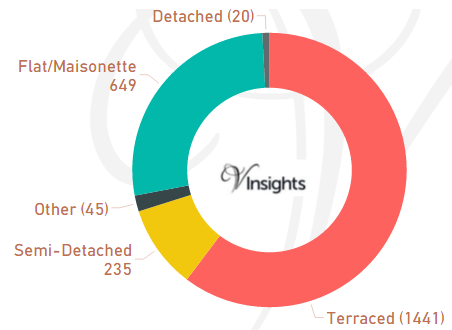
In Barking And Dagenham the total number of properties sold in year 2016 was 2390.
The breakdown by different property types are:
- Terraced 1441(60.29%)
- Semi-Detached 235(9.83%)
- Other 45(1.88%)
- Flat/Maisonette 649(27.15%)
- Detached 20(0.84%)
Year on Year Comparison : Compared to Barking And Dagenham Property Market 2015 in 2016
- Total number of property sales in Barking and Dagenham has declined by 8.2%
- Except Semi-Detached all property types have shown decrease in total number of properties sold year on year.
- Semi-Detached has shown growth of 3.5%
Average & Median Sales Price
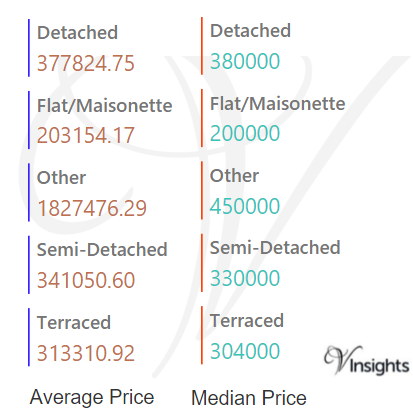
In 2016 the Average property price was £315 K in Barking and Dagenham.
The average property price for the different property types are:
- Detached £378 K
- Flat/Maisonette £203 K
- Other £1.83 millions
- Semi-Detached £341 K
- Terraced £313 K
The Median Price in Barking and Dagenham was £287 K.
The median property price for the different property types are:
- Detached £380 K
- Flat/Maisonette £200 K
- Other £450 K
- Semi-Detached £330 K
- Terraced £304 K
Year on Year Comparison : Compared to Barking And Dagenham Property Market 2015
- The average and median sales price across all property types have gone up except for others
New Vs Not New Property Statistics
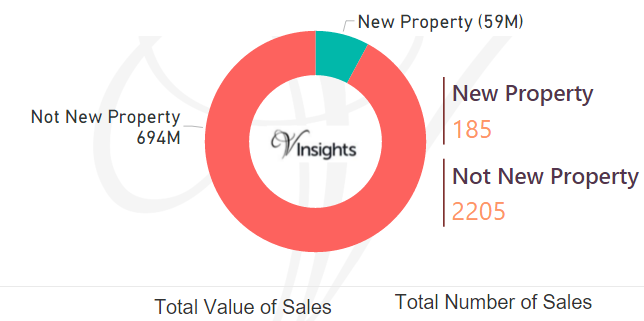
By Value Of Sales
- Not New Property contributed £694 millions (92.12%)
- New Property £59 millions (7.88%)
By Number Of Sales
- Not New Property sold was 2205 (92.26%)
- New Properties sold were 185 (7.74%)
Year on Year Comparison : Compared to Barking And Dagenham Property Market 2015 in 2016
- New property market share by Sales Values in property market has not shown appreciable change
All London Posts
f4ac1aff-b3be-4d0e-bb2a-6f38773a5e2f|0|.0|27604f05-86ad-47ef-9e05-950bb762570c