Story Highlights
- Waltham Forest had total Property Sales of £1.46 billions in 2016
- The total number of properties sold in year 2016 was 3313
- The Average property price was £441 K while Median was £417 K
- Not New Property contributed 94.82% by value and New Property 5.18%
- Stamp duty changes caused monthly spike in March
- Brexit coupled with Stamp Duty changes have caused decline of 3.3% in 2016 over 2015
Waltham Forest is one of the Boroughs of East London. It had total Property Sales of £1.46 billions, which was 8.9% of East London Property Market 2016.
Total Sales By Property Type
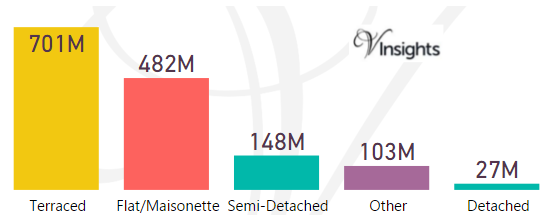
The split of £1.46 billions across the different property types are:
- Terraced £701 millions (47.99%)
- Flat/Maisonette £482 millions (32.98%)
- Semi Detached £148 millions (10.14%)
- Other £103 millions (7.06%)
- Detached £27 millions (1.83%)
Year on Year Comparison : Compared to Waltham Property Market 2015 in 2016
- All the property types have shown decline in sales except others.
- Others has shown growth of 19.76% year on year
Waltham Forest Property Market at Postcode level
| Postcode |
Coverage Area
|
Local Authority Area |
| E4 |
Chingford district: Chingford, Sewardstone, Highams Park, Upper Edmonton (part), Woodford Green (part)
|
Waltham Forest, Enfield, Epping Forest (Essex) |
| E5 |
Clapton district: Leyton (Part), Upper Clapton, Lower Clapton, Stoke Newington (part)
|
Hackney, Waltham Forest |
| E7 |
Forest Gate district: Forest Gate, Leytonstone (Part), Stratford (part)
|
Newham, Waltham Forest |
| E10 |
Leyton district: Leyton, Temple Mills, Hackney Marshes (part) Upper Clapton (part), Walthamstow Marshes
|
Waltham Forest, Hackney |
| E11 |
Leytonstone district: Leytonstone, Wanstead, Aldersbrook (part), Snaresbrook, Cann Hall
|
Waltham Forest, Redbridge |
| E15 |
Stratford district: Stratford, West Ham (part), Maryland, Leyton (part), Leytonstone (part) Temple Mills (part), Hackney Wick (part), Bow (part)
|
Newham, Waltham Forest, Hackney, TowerHamlets |
| E17 |
Walthamstow district: Walthamstow, Upper Walthamstow, Leyton (part)
|
Waltham Forest |
| IG8 |
Woodford Green, Woodford Bridge, Highams Park (part)
|
Redbridge, Waltham Forest |
For property market details at post code level please click on Postcode in the table above.
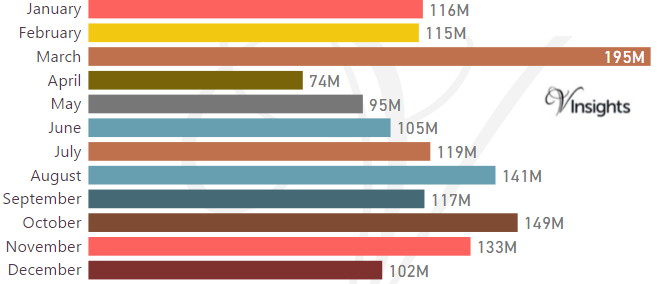
Month-wise Break-up of Total Sales
Stamp Duty Hike Impact
- March had property sale spike of £195 millions compared to £115 millions in Feb
- The impetus for it was to avoid the extra 3% in Stamp Duty Tax applicable on buying an additional home, being applicable from April 1 2016
Brexit Impact
- Brexit took place on 23rd June 2016.
- As can be observed from the month-wise break-up there does not seem to have been significant dip in property sales in the immediate aftermath of Brexit
- Year on Year the property market for Waltham Forest has shown decline of 3.3% over 2015
Total Number Of Sales By Property Types
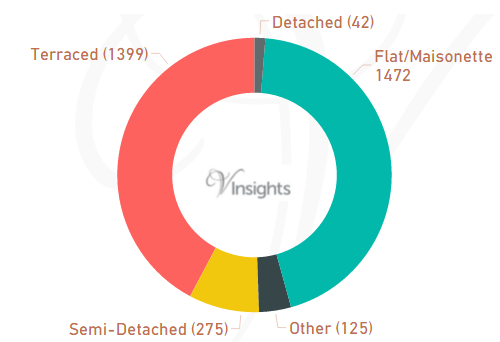
In Waltham Forest the total number of properties sold in year 2016 was 3313. The breakdown by different property types are:
- Terraced 1399 (42.23%)
- Semi Detached 275 (8.3%)
- Other 125 (3.77%)
- Flat/Maisonette 1472 (44.43%)
- Detached 42 (1.27%)
Year on Year Comparison : Compared to Waltham Property Market 2015 in 2016
- Total number of property sales in Waltham Forest has declined by 13.65% decline
- All property types have shown decline in number of properties sold except property type Other
- Other has shown significant increase of 155%.
Average & Median Sales Price
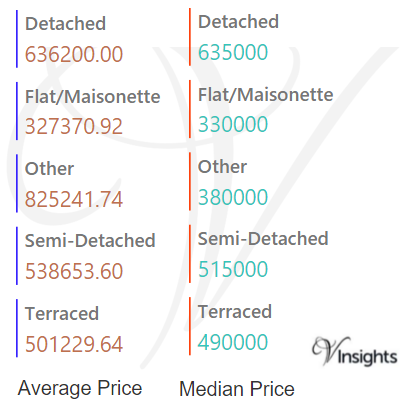
In 2016 the Average property price was £441 K in Waltham Forest. The average price for the different property types are:
- Detached £636 K
- Flat/Maisonette £327 K
- Other £825 K
- Semi-Detached £539 K
- Terraced £501 K.
The Median Price was £417 K. The median property price for the different property types are:
- Detached £635 K
- Flat/Maisonette £330 K
- Other £380 K
- Semi-Detached £515 K
- Terraced £490 K
Year on Year Comparison : Compared to Waltham Property Market 2015 in 2016
- The average and median sales price across all property types have gone up except for others
- Other have shown decline in average and median sales price making the property for business/commercial purpose cheaper
New Vs Not New Property Statistics
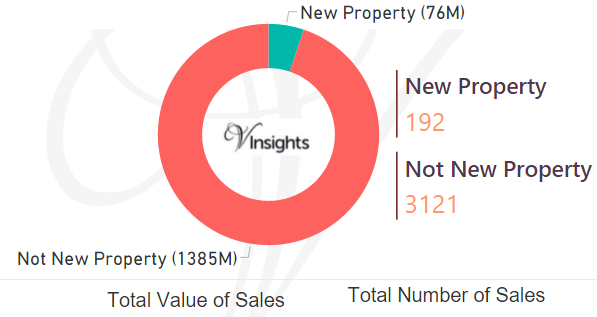
By Value Of Sales
- Not New Property contributed £1.39 (94.82%)
- New Property £76 millions (5.18%)
By Number Of Sales
- The number of Not New Property sold was 3121 (94.2%)
- The number of New Properties sold was 192 (5.8%)
Year on Year Comparison : Compared to Waltham Property Market 2015 in 2016
- New property market share in property market has remained fairly constant in 2016 over 2015
All London Posts
d4d89dfe-3f54-4cfb-80f9-701489e4ab51|0|.0|27604f05-86ad-47ef-9e05-950bb762570c