Story Highlights
- Dover had total property sales of £593 Billions in 2016
- The total number of properties sold in 2016 was 2,413
- The average sales price in Dover was £246 K, whereas the median was £208 K
- New Property sales were 9.69% by value, whereas Not New Property contributed 90.31%
- Stamp duty changes caused monthly spike in March
- Brexit coupled with Stamp Duty changes did not have negative impact, there was robust growth of 7%
Total Sales By Property Type
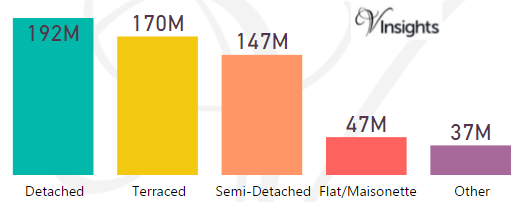
Dover had total property sales of £593 millions which was 7% of the total Kent Property Market 2016
The split £593 millions across the different property types are:
- Detached £192 millions (32.44%)
- Terraced £170 millions (28.64%)
- Semi-Detached £147 millions (24.85%)
- Flat/Maisonette £47 millions (7.89%)
- Other £37 millions (6.19%)
Month-wise Break-up of Total Sales
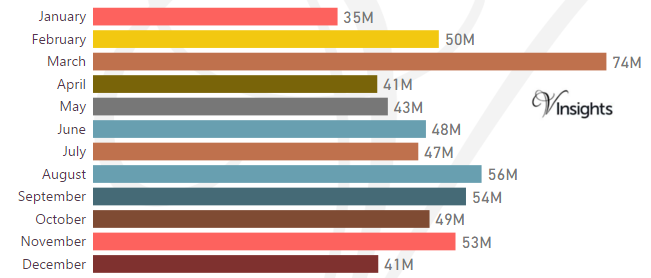
Some of the insights based on the £593 millions month-wise break-down :
Stamp Duty Hike Impact
- March had property sale spike of £74 millions compared to £50 millions in Feb
- The impetus for it was to avoid the extra 3% in Stamp Duty Tax applicable on buying an additional home, being applicable from April 1 2016
Brexit Impact
- Brexit took place on 23rd June 2016.
- Year on Year growth has been 7% in 2016 over 2015
- Brexit coupled with Stamp Duty Hike had negative impact on Dover Property Market in 2016
Total No Of Properties Sold By Property Type

Dover had total property sales of 2413. The split across different property types are:
- Terraced 874 (36.22%)
- Semi-Detached 639 (26.48%)
- Detached 518 (21.47%)
- Flat/Maisonette 320 (13.26%)
- Other 62 (2.57%)
Average & Median Sales Price
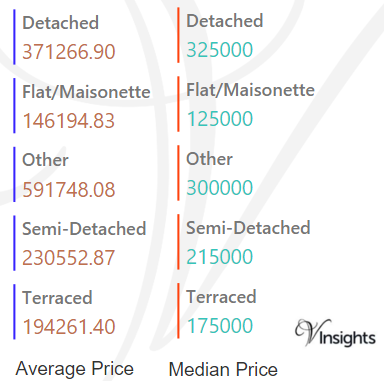
The average sales price in Dover was £246 K and for different property types it was:
- Detached £371 K
- Semi-Detached £231 K
- Terraced £194 K
- Flat/Maisonette £146 K
- Other it is £592 K
Similarly median sales price in Dover was £208 K and for different property types are:
- Detached £325 K
- Semi-Detached £215 K
- Terraced £175 K
- Flat/Maisonette £125 K
- Other it is £300 K
New Vs Not New Property Statistics
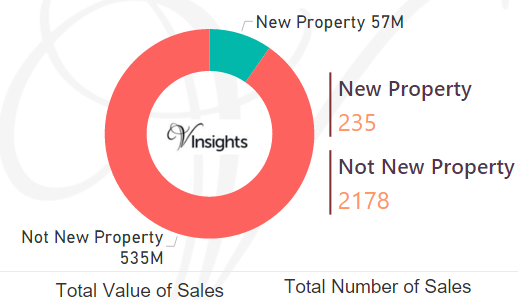
By Sales Value the split is as follows:
- New Property contributed £57 millions (9.69%)
- Not New Property contributed £535 millions (90.31%)
By Total Number the split is as follows:
- New properties sold were 235 (9.74%)
- Not new property sold were 2,178 (90.26%)
All Kent Posts

68696a10-ebb7-425f-af06-59c841053cb2|0|.0|27604f05-86ad-47ef-9e05-950bb762570c