Story Highlights
- Kent had total property sales of £9.3 Billions in 2016
- The total number of properties sold in 2016 was 29,436
- The average sales price in Kent was £317 K, whereas the median was £258 K
- Across it's districts average sales price was maximum for Sevenoaks at £525 K
- New Property sales were 9.72% by value, whereas Not New Property contributed 90.28%
- Stamp duty changes caused monthly spike in March
- Brexit coupled with Stamp Duty changes did not have negative impact, there was robust growth of 6.29%
Kent is one of the counties of South East England. The districts of Kent are Tunbridge Wells, Maidstone, Sevenoaks, Tonbridge and Malling, Canterbury, Ashford, Dartford, Thanet, Swale, Dover, Shepway, Gravesham. Let us look at the Kent Property Market for 2016 in detail.
Total Sales By Districts
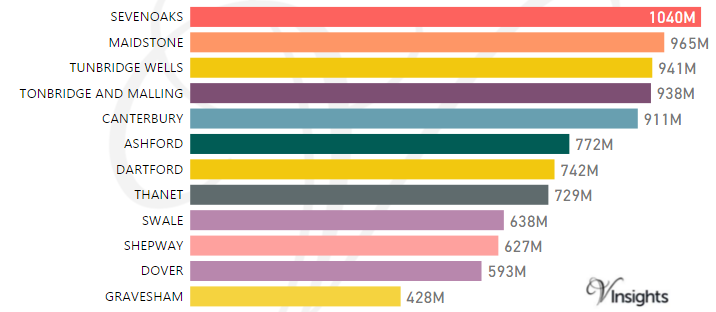
Kent had total property sales of £9.3 Billions which was 15.06% of the total South East property Market in 2016
The split of the sales across the different districts was:
Year on Year Comparison : Compared to Kent Property Market 2015 in 2016
Total Sales By Property Type
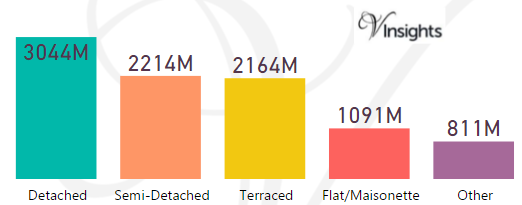
The split of £9.3 Billions in Kent across the different property types are:
- Detached £3.04 billions (32.65%)
- Semi-Detached £2.21 billions (23.75%)
- Terraced £2.16 billions (23.21%)
- Flat/Maisonette £1.09 billions (11.7%)
- Other £811 millions (8.69%)
Year on Year Comparison : Compared to Kent Property Market 2015 in 2016
- All the property types sales have shown growth except Detached
Month-wise Break-up of Total Sales
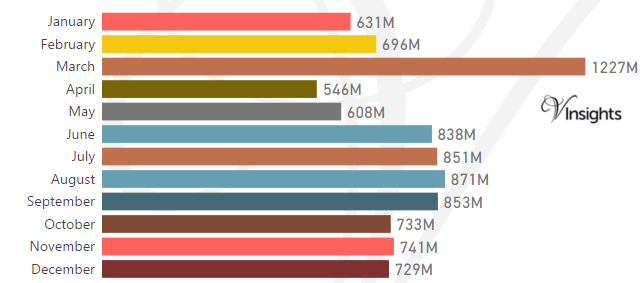
Some of the insights based on the £9.3 Billions month-wise break-down :
Stamp Duty Hike Impact
- March had property sale spike of £1.2 billions compared to £696 millions in Feb
- The impetus for it was to avoid the extra 3% in Stamp Duty Tax applicable on buying an additional home, being applicable from April 1 2016
Brexit Impact
- Brexit took place on 23rd June 2016.
- Year on Year growth (compared to 2015) has been 6.29% in 2016
- So, Brexit coupled with Stamp Duty Hike did not have negative impact on Kent Property Market in 2016
Total No Of Properties Sold By Property Type
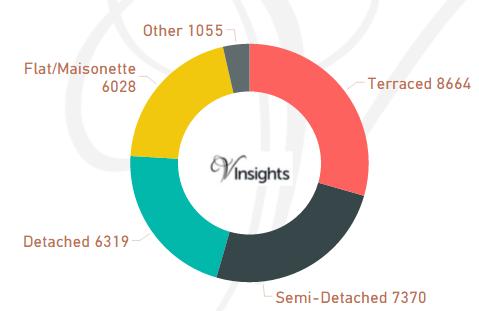
Kent had total property sales of 29,436. The split across different property types are:
- Terraced 8,664 (29.43%)
- Semi-Detached 7,370 (25.04%)
- Detached 6,319 (21.47%)
- Flat/Maisonette 6,028 (20.48%)
- Other 1,055 (3.58%)
Year on Year Comparison : Compared to Kent Property Market 2015 in 2016
- Total number of property sales in 2016 has decreased by 1.9%.
- All property types have shown decline in number of properties sold except property type Flat/Maisonette, Other
- Other has shown significant increase of 129%
Average & Median Sales Price
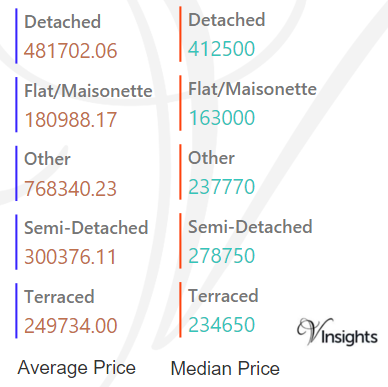
The average sales price in Kent was £317 K. For the different property types it was
- Detached at £482 K
- Semi-Detached at £300 K
- Terraced at £250 K
- Flat/Maisonette at £181 K
- Other it is at £768 K
Similarly median sales price in Kent was £258 K. For different property types it was
- Detached at £413 K
- Semi-Detached at £279 K
- Terraced at £235 K
- Flat/Maisonette at £163 K
- Other it is at £238 K
Year on Year Comparison : Compared to Kent Property Market 2015 in 2016
- The average and median property prices have gone up except for property type Other
- Other has had decline in average and median property price
Average & Median Sales Price By Districts
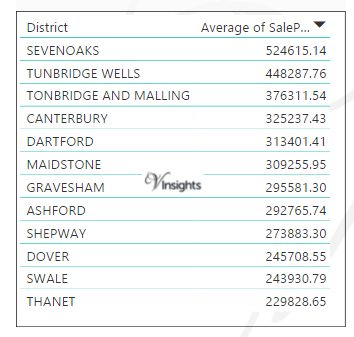
Across districts the average sales price is as above.
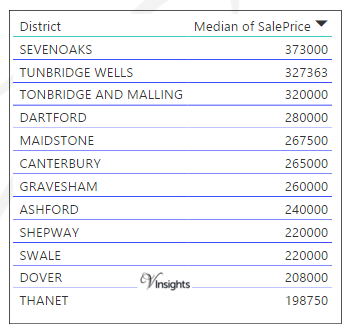
Across districts the median sales price is as above.
Year on Year Comparison : Compared to Kent Property Market 2015 in 2016
- The average sales price across all the counties have gone up except for Maidstone.
- The median sales price across all the counties have gone up
New Vs Not New Property Statistics
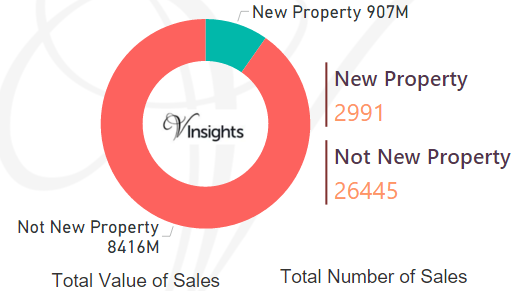
By Sales Value the split is as follows:
- New Property contributed £907 millions (9.72%)
- Not New Property contributed £8.42 billions (90.28%)
By Total Number the split is as follows:
- New properties sold were 2,991 (10.16%)
- Not new property sold were 26,445 (89.84%)
Year on Year Comparison : Compared to Kent Property Market 2015 in 2016
- New property market share in property market has remained constant
All Kent Posts

b319ec4d-93ea-4f15-aacf-f7d95978aacb|0|.0|27604f05-86ad-47ef-9e05-950bb762570c