Bristol Property Market 2016 at Postcode Level with School Details


Postcode Coverage Area School Local Authority Area
BS1 Bristol city centre,Redcliffe Details Bristol
BS2 Kingsdown,St Pauls,St Phillips,St Agnes Details Bristol
BS3 Bedminster,Southville,Bower Ashton, part ofTotterd own,Windmill Hill Details Bristol
BS4 Brislington,Knowle,Knowle West,St Annes, part of T otterdown Details Bristol
BS5 Easton,St George,Redfield,Whitehall,Eastville,Spee dwell,Greenbank,Barton Hill Details Bristol
BS6 Cotham,Redland,Montpelier,Westbury Park,St. Andrew s Details Bristol
BS7 Bishopston,Horfield, part ofFilton,Lockleaze,Ashle y Down, Details Bristol,South Gloucestershire
BS8 Clifton,Failand,Hotwells,Leigh Woods Details Bristol, North Somerset
BS9 Coombe Dingle,Sneyd Park,Stoke Bishop,Westbury on Trym,Henleaze, Bristol Details Bristol
BS10 Brentry,Henbury,Southmeadpart of Westbury on Trym, Details Bristol
BS11 Avonmouth,Shirehampton,Lawrence Weston Details Bristol
BS13 Bedminster Down,Bishopsworth,Hartcliffe,Withywood, Headley Park Details Bristol
BS14 Hengrove,Stockwood,Whitchurch,Withywood Details Bristol ,Bath and North East Somerset
BS15 Hanham,Kingswood Details Bristol , South Gloucestershire
BS16 Downend,Emersons Green,Fishponds,Frenchay,Pucklech urch,Staple Hill Details Bristol , South Gloucestershire


 For 2015 Post - Bristol Property Market 2015

All South West England Posts

Bournemouth Property Market 2016 at Postcode Level with School Details


Postcode Coverage Area School Local Authority Area
BH1 Town Centre,Springbourne, East Cliff,Boscombe Details Bournemouth
BH2 Bournemouth Central, West Cliff Details Bournemouth
BH3 Talbot Woods,Winton Details Bournemouth
BH4 Westbourne, Branksome Woods Details Bournemouth
BH5 Boscombe,Pokesdown Details Bournemouth
BH6 Southbourne,Tuckton,Wick Details Bournemouth
BH7 Littledown,Iford Details Bournemouth
BH8 Malmesbury Park, Queens Park, Strouden Park, Towns end,Holdenhurst,Throop Details Bournemouth
BH9 Winton,Moordown,Throop, Muscliff Details Bournemouth
BH10 Kinson,East Howe, Northbourne, Redhill,Ensbury Par k,Wallisdown Details Bournemouth
BH11 Kinson,Bear Cross,West Howe,Wallisdown Details Bournemouth


For 2015 Post - Bournemouth Property Market 2015


All South West England Posts


Bath and North East Somerset Property Market 2016 at Postcode Level with School Details


Postcode Coverage Area School Local Authority Area
BA1 Bath north of the Avon,Batheaston Details Bath and North East Somerset
BA2 Bath south of the Avon,Peasedown St John Details Bath and North East Somerset
BA3 Radstock, Midsomer Norton, Holcombe, Coleford Details Bath and North East Somerset
BS14 Hengrove,Stockwood,Whitchurch,Withywood Details Bristol /Bath and North East Somerset
BS31 Chewton Keynsham,Keynsham,Saltford Details Bath and North East Somerset
BS39 Clutton,Temple Cloud Details Bath and North East Somerset
BS40 Chew Valley,Chew Magna,Chew Stoke,Wrington Details Bath and North East Somerset, North Somerset


For 2015 Post - Bath and North East Somerset Property Market 2015


All South West England Posts


South West England Property Market 2016

Story Highlights

  • South West had total property sales of £31 Billions in 2016
  • Across its counties the property sale was maximum in Devon at £4.43 Billions
  • The number of properties sold in South West was 109,500 properties.
  • The average sales price in South West was £280 K, while median was £225 k.
  • The average sales price across counties was maximum in Bath And North East Somerset at £410 K
  • New properties contributed 8.13% and not new property contributed 91.87% by value
  • Stamp duty hike caused monthly spike in March
  • Brexit coupled with Stamp Duty did not have negative impact on South West England property market 2016


South West England is one of the 9 principal areas of England. It comprises of Bath and North East Somerset, North Somerset, Bristol, South Gloucestershire, Gloucestershire, Swindon, Wiltshire, Dorset, Poole, Bournemouth, Somerset, Devon, Torbay, City Of Plymouth, Isles of Scilly, Cornwall.


Total Sales By County
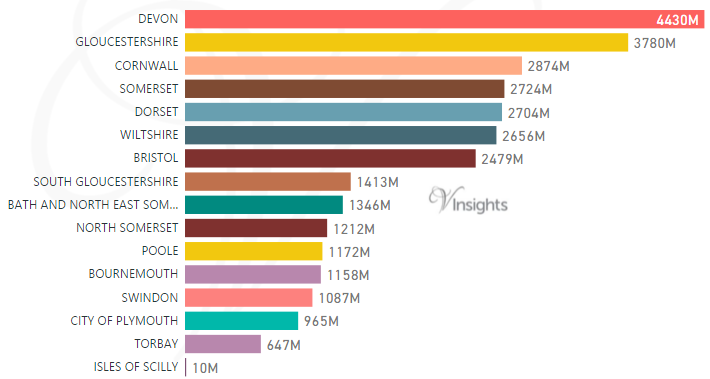
South West England - Total Sales By County

South West had total property sales of £31 Billions. It contributed 10.31% of the England and Wales Property Market 2016 

The total sales of £31 billions in 2016 was split across its counties as above.


Year on Year Comparison : Compared to South West England Property Market 2015  in 2016

  • All the counties had growth in total sales except Swindon, Torbay


Total Value of Sales By Property Types
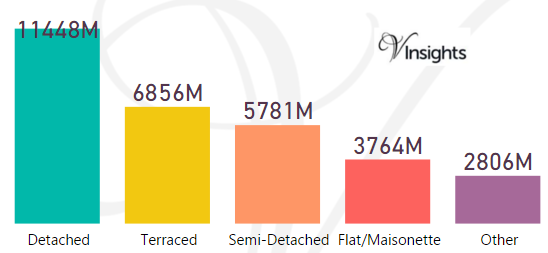
South West England - Total Value of Sales By Property Types

The split of £31 Billions across the different property types was :

  • Detached at £11.45 billions (37.34%)
  • Terraced at £6.86 billions (22.36%)
  • Semi-Detached  at £5.78 billions (18.86%)
  • Flat/Masionette at £3.76 billions (12.28%)
  • Other at £2.81 Billions (9.15%)

Year on Year Comparison : Compared to South West England Property Market 2015  in 2016

  • All the property types sales value have shown growth except Detached
  • Year on Year growth was 3.33% compared to 2015 


Month-wise Break-up of Total Sales
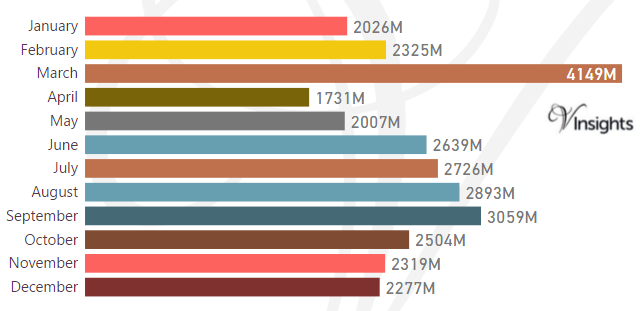
South West England - Month-wise Break-up of Total Sales

Some of the insights based on the £31 billions month-wise break-down :

Stamp Duty Hike Impact

  1. March had property sale spike of £4.15 billions compared to £2.33 billions in Feb
  2. The impetus for it was to avoid the extra 3% in Stamp Duty Tax applicable on buying an additional home, being applicable from April 1 2016

Brexit Impact

  1. Brexit took place on 23rd June 2016.
  2. As can be observed from the month-wise break-up there does not seem to have been dip in property sales in the immediate aftermath of Brexit 
  3. Year on Year growth was 3.33% compared to 2015 
  4. Brexit coupled with Stamp Duty did not have negative impact on South West England property market 2016


Total Number of Sales By Property Types
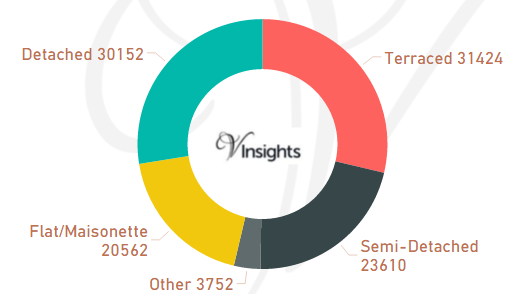
South West England - Total Number of Sales By Property Types

The total property sales of £31 Billions in 2016 was spread over 109,500 properties.

  • Terraced properties at 31,424 (28.7%) ,
  • Detached at 30,152 (27.54%),  
  • Semi-Detached at 23,610 (21.56%),
  • Flat/Maisonette at 20,562 (18.78%),
  • Others at 3,752 (3.43%) 

Year on Year Comparison : Compared to South West England Property Market 2015 in 2016

  • Total number of property sales in 2016 has decreased by  2.02%.
  • All property types have shown decline in number of properties sold except property type Other.
  • Other has shown significant increase of 114% 


Average & Median Sales Price
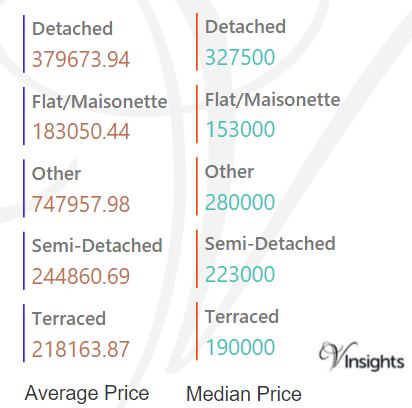
South West England - Average & Median Sales Price

The average sales price in South West was £280 K. For the different property types it was

  • Detached at £380 K
  • Semi-Detached at £245 K
  • Terraced at £218 K
  • Flat/Maisonette at £183 K
  • Other it is at £748 K

The median sales price in South West was £225 K. For the different property types it was

  • Detached £328 K
  • Semi-Detached £223 K
  • Terraced £190 K
  • Flat/Maisonette £153 K
  • Other £280 K

Year on Year Comparison : Compared to South West England Property Market 2015 in 2016

  • The average and median property prices have gone up except for property type Other
  • Other has had decline in average and median property price


Average & Median Sales Price By County
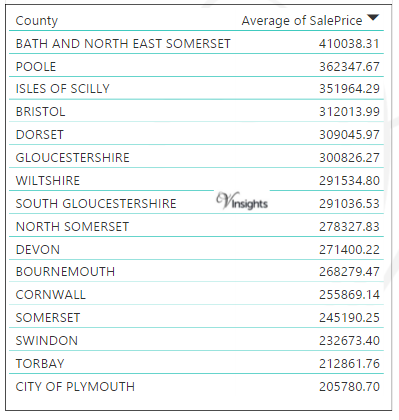
South West England - Average Sales Price By County

The average sales price for the counties of South West England are as above.
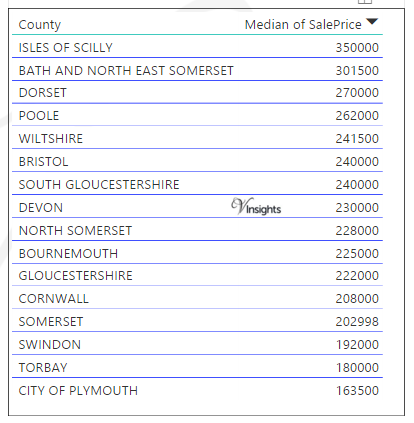
 South West England -Median Sales Price By County


Year on Year Comparison : Compared to South West England Property Market 2015 in 2016

  • The average and median sales price across all the counties have gone up


New Vs Not New Property Statistics
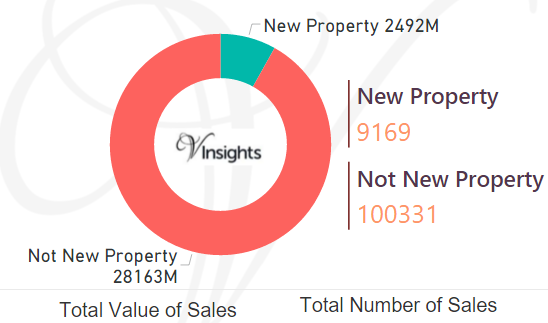
South West England - New Vs Not New Property Statistics

By Sales Value

  • The sales value contributed by New Property was £2.49 billions (8.13%)
  • where as Not New Property contributed £28.16 billions (91.87%)

By Number Of Sales

  • Number of new properties sold were 9,169 (8.37%)
  • where as not new property sold were 100,331 (91.63%).

Year on Year Comparison : Compared to South West England Property Market 2015 in 2016

  • New property market share in property market has gone down in 2016 over 2015


All South West England Posts


Wiltshire Property Market 2015

 For 2016 Details : Wiltshire Property Market 2016 at Postcode Level with School Details

Story Highlights

  • Wiltshire had total property sales of £2.64 Billions in 2015
  • The total number of properties sold in 2015 was 9,376
  • The average sales price in Wiltshire was £282 K, whereas median was £230 K
  • New Property sales were 12.92% by value, whereas Not New Property contributed 87.08%


Wiltshire is a county in South West England

Total Value of Sales By Property Types

Wiltshire - Total Value of Sales By Property Types

Wiltshire had total property sales of £2.64 Billions which was 8.91% of the total South West property Market in 2015.

 The split across the different property types in Wiltshire are:

  • Terraced £556 millions (21.06%)
  • Semi-Detached £513 millions (19.44%)
  • Other £138 millions (5.23%)
  • Flat/Maisonette £166 millions (6.27%)
  • Detached £1.27 Billions (48%)


Total Number of Sales By Property Types

Wiltshire - Total Number of Sales By Property Types

Wiltshire had total property sales of 9,376. The split across the different property types are:

  • Detached 3,292 (35.11%)
  • Flat/Maisonette 1,068 (11.39%)
  • Other 146 (1.56%)
  • Semi-Detached 2,152 (22.95%)
  • Terraced 2,718 (28.99%)


Average & Median Sales Price

Wiltshire - Average & Median Sales Price

The average sales price in Wiltshire was £282 K and for the different property types it was:

  • Detached £385 K
  • Semi-Detached £238 K
  • Terraced £205 K
  • Flat/Maisonette £155 K
  • Other it is £945 K

Similarly median sales price in Wiltshire was £230 K and for the different property types it was:

  • Detached £328 K
  • Semi-Detached £215 K
  • Terraced £183 K
  • Flat/Maisonette £130 K
  • Other it is £340 K


New Vs Not New Property Statistics

Wiltshire - New Vs Not New Property Statistics

By Sales Values the split is as follows:

  • New Property contributed £341 millions (12.92%)
  • Not New Property contributed £2.3 billions (87.08%)

By Total Number the split is as follows:

  • New properties sold were 1,253 (13.36%)
  • Not new property sold were 8,123 (86.64%)


All South West England Posts