For 2016 Details - Torbay Property Market 2016 at Postcode Level with School Details
Story Highlights
- Torbay had total property sales of £674 millions in 2015
- The total number of properties sold in 2015 was 3,212
- The average sales price in Torbay was £210 K, whereas median was £175 K
- New Property sales were 6.54% by value, whereas Not New Property contributed 93.46%
Torbay is an unitary authority council in South West England
Total Value of Sales By Property Types
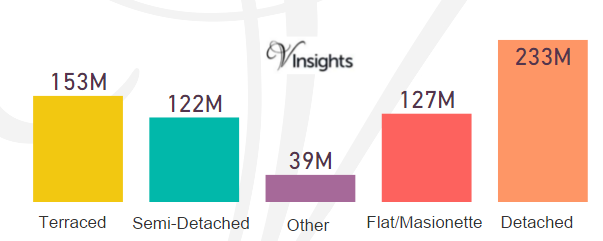
Torbay had total property sales of £674 millions which was 2.28% of the total South West property Market in 2015.
The split across the different property types in Torbay are:
- Terraced £153 millions (22.66%)
- Semi-Detached £122 millions (18.06%)
- Other £39 millions (5.83%)
- Flat/Maisonette £127 millions (18.86%)
- Detached £233 millions (34.58%)
Total Number of Sales By Property Types
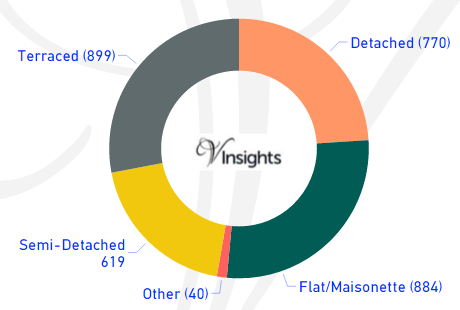
Torbay had total property sales of 3,212. The split across the different property types are:
- Detached 770 (23.97%)
- Flat/Maisonette 884(27.52%)
- Other 40 (1.25%)
- Semi-Detached 619 (19.27%)
- Terraced 899 (27.99%)
Average & Median Sales Price
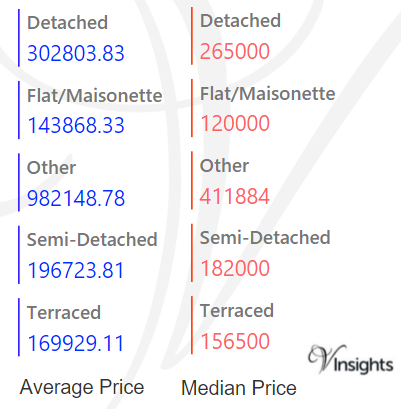
The average sales price in Torbay was £210 K and for the different property types it was:
- Detached £303 K
- Semi-Detached £197 K
- Terraced £170 K
- Flat/Maisonette £144 K
- Other it is £982 K
Similarly median sales price in Torbay was £175 K and for the different property types it was:
- Detached £265 K
- Semi-Detached £182 K
- Terraced £157 K
- Flat/Maisonette £120 K
- Other it is £412 K
New Vs Not New Property Statistics
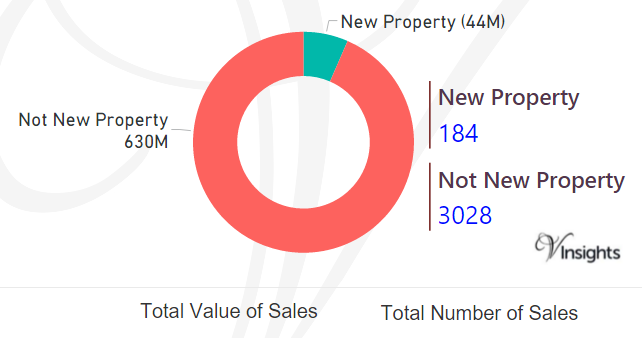
By Sales Values the split is as follows:
- New Property contributed £44 millions (6.54%)
- Not New Property contributed £630 millions (93.46%)
By Total Number the split is as follows:
- New properties sold were 184 (5.73%)
- Not new property sold were 3,028 (94.27%)
All South West England Posts

2ad378cd-bc7d-4637-a51d-a32f166d3e89|0|.0|27604f05-86ad-47ef-9e05-950bb762570c
For 2016 Details : Swindon Property Market 2016 at Postcode Level with School Details
Story Highlights
- Swindon had total property sales of £1.09 Billions in 2015
- The total number of properties sold in 2015 was 4,763
- The average sales price in Swindon was £229 K, whereas median was £179 K
- New Property sales were 12.84% by value, whereas Not New Property contributed 87.16%
Swindon is an unitary authority council in South West England
Total Value of Sales By Property Types
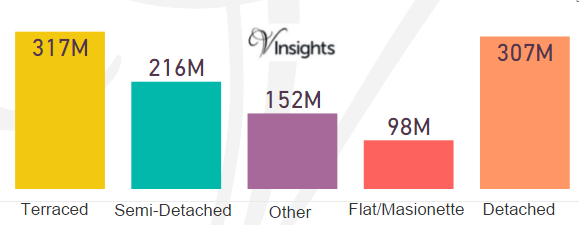
Swindon had total property sales of £1.09 Billions which was 3.68% of the total South West property Market in 2015.
The split across the different property types in Swindon are:
- Terraced £317 millions (29.04%)
- Semi-Detached £216 millions (19.82%)
- Other £152 millions (13.97%)
- Flat/Maisonette £98 millions (9.02%)
- Detached £307 millions (28.15%)
Total Number of Sales By Property Types
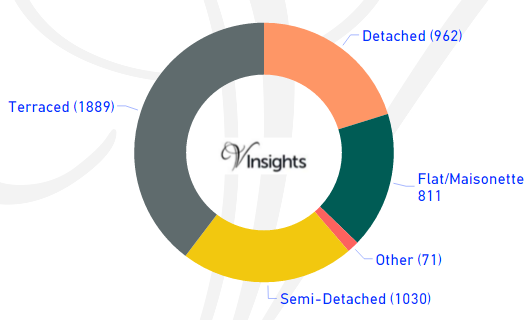
Swindon had total property sales of 4,763. The split across the different property types are:
- Detached 962 (20.2%)
- Flat/Maisonette 811(17.03%)
- Other 71 (1.49%)
- Semi-Detached 1,030 (21.63%)
- Terraced 1,889 (39.66%)
Average & Median Sales Price
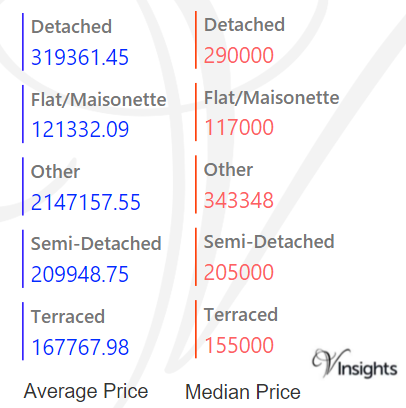
The average sales price in Swindon was £229 K and for the different property types it was:
- Detached £319 K
- Semi-Detached £210 K
- Terraced £168 K
- Flat/Maisonette £121 K
- Other it is £2.15 millions
Similarly median sales price in Swindon was £179 K and for the different property types it was:
- Detached £290 K
- Semi-Detached £205 K
- Terraced £155 K
- Flat/Maisonette £117 K
- Other it is £343 K
New Vs Not New Property Statistics
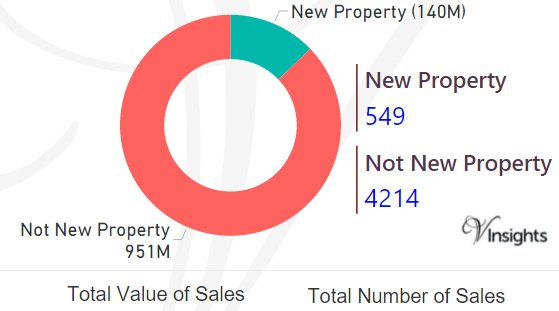
By Sales Values the split is as follows:
- New Property contributed £140 millions (12.84%)
- Not New Property contributed £951 millions (87.16%)
By Total Number the split is as follows:
- New properties sold were 549 (11.53%)
- Not new property sold were 4,214(88.47%)
All South West England Posts
92bccf76-4328-445e-96d7-ee5c57f62e1e|0|.0|27604f05-86ad-47ef-9e05-950bb762570c
For 2016 Details : South Gloucestershire Property Market 2016 at Postcode Level with School Details
Story Highlights
- South Gloucestershire had total property sales of £1.41 Billions in 2015
- The total number of properties sold in 2015 was 5,214
- The average sales price in South Gloucestershire was £270 K, whereas median was £227 K
- New Property sales were 14.84% by value, whereas Not New Property contributed 85.16%
South Gloucestershire is an unitary authority council in South West England
Total Value of Sales By Property Types
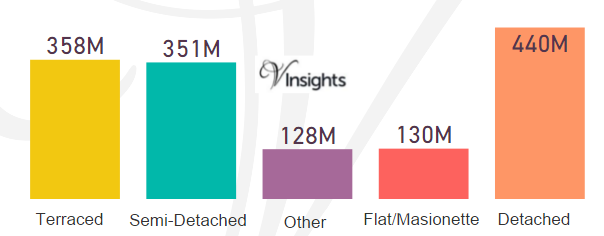
South Gloucestershire had total property sales of £1.41 Billions which was 4.75% of the total South West property Market in 2015.
The split across the different property types in South Gloucestershire are:
- Terraced £358 millions (25.42%)
- Semi-Detached £351 millions (24.94%)
- Other £128 millions (9.12%)
- Flat/Maisonette £130 millions (9.22%)
- Detached £440 millions (31.3%)
Total Number of Sales By Property Types
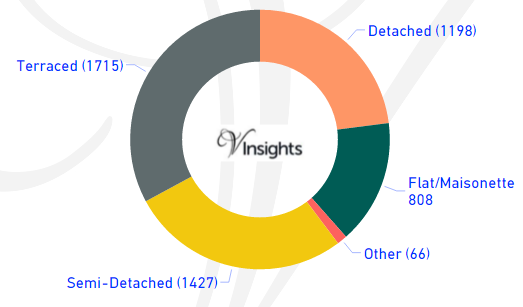
South Gloucestershire had total property sales of 5,214. The split across the different property types are:
- Detached 1,198 (22.98%)
- Flat/Maisonette 808 (15.5%)
- Other 66 (1.27%)
- Semi-Detached 1,427(27.37%)
- Terraced 1,715 (32.89%)
Average & Median Sales Price
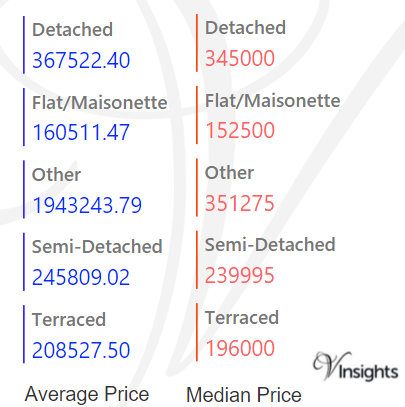
The average sales price in South Gloucestershire was £270 K and for the different property types it was:
- Detached £368 K
- Semi-Detached £246 K
- Terraced £209 K
- Flat/Maisonette £161 K
- Other it is £194 K
Similarly median sales price in South Gloucestershire was £227 K and for the different property types it was:
- Detached £345 K
- Semi-Detached £240 K
- Terraced £196 K
- Flat/Maisonette £153 K
- Other it is £351 K
New Vs Not New Property Statistics
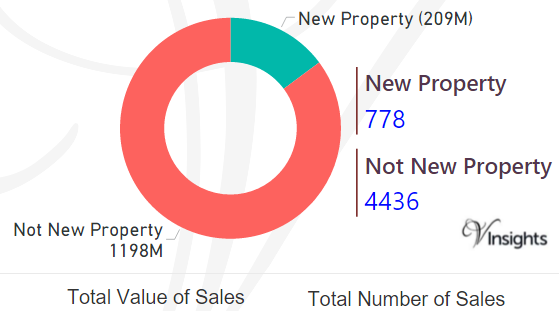
By Sales Values the split is as follows:
- New Property contributed £209 millions (14.84%)
- Not New Property contributed £1.2 billions (85.16%)
By Total Number the split is as follows:
- New properties sold were 778 (14.92%)
- Not new property sold were 4,436 (85.08%)
All South West England Posts
77eaf156-ee36-4565-a5af-ab07819bb06c|0|.0|27604f05-86ad-47ef-9e05-950bb762570c
Story Highlights
- Somerset had total property sales of £2.62 Billions in 2015
- Across its districts South Somerset has maximum sales of £786 millions and with minimum for West Somerset at £158 millions.
- The total number of properties sold in 2015 was 8,834
- The average sales price in Somerset was £237 K, whereas the median was £192 K
- Across its districts average sales price in Somerset was maximum for Mendip at £244 K and minimum for West Somerset at £225 K
- Similarly the median sales price in Somerset was maximum for Mendip at £210 K and was minimum for Sedgemoor at £180 K
- New Property sales were 12.66% by sales value, whereas Not New Property contributed 87.34%
Somerset is one of the counties of South West England. The districts of Somerset are South Somerset, Taunton Deane, Sedgemoor, Mendip, West Somerset.
Total Value of Sales By Property Types
Somerset had total property sales of £2.62 Billions which was 8.86% of the total South West property Market in 2015 and was sixth highest across all the counties in South West England.
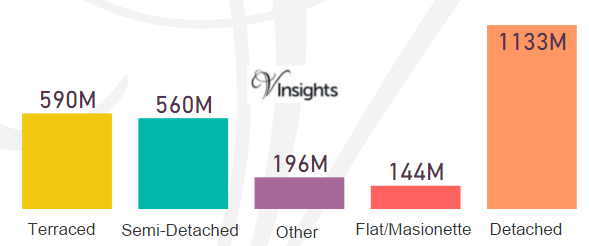
The split across the different property types in Somerset are:
- Terraced £590 millions (22.48%)
- Semi-Detached £560 millions (21.35%)
- Other £196 millions (7.48%)
- Flat/Maisonette £144 millions (5.5%)
- Detached £1.13 billions (43.19%)
Total Sales By Districts
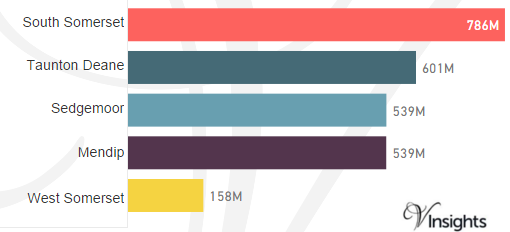
The split of the £2.62 Billions sales in Somerset across the different districts is as above.
- It was maximum for South Somerset £786 millions (29.98%)
- Taunton Deane at £601 millions (22.91%)
- Sedgemoor £539 millions (20.56%)
- Mendip £539 millions (20.54%)
- with minimum for West Somerset at £158 millions (6.01%)
Total Number of Sales By Property Types
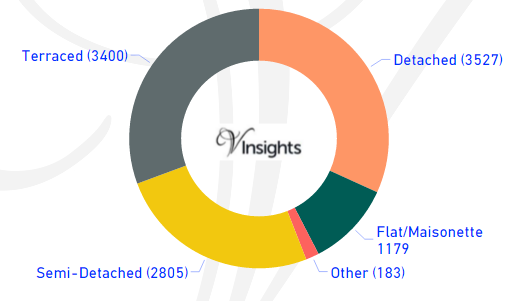
Somerset had total number property sales of 11,094. The split across the different property types are:
- Detached 3,527 (31.79%)
- Flat/Maisonette 1,179 (10.63%)
- Other 183 (1.65%)
- Semi-Detached 2805 (25.28%)
- Terraced 3400 (30.65%)
Average & Median Sales Price
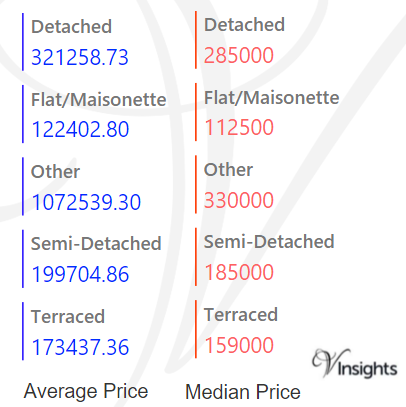
The average sales price in Somerset was £237 K and for the different property types it was:
- Detached £321 K
- Semi-Detached £200 K
- Terraced £173 K
- Flat/Maisonette £122 K
- Other it is £1.07 millions
Similarly median sales price in Somerset was £192 K and for the different property types are:
- Detached £285 K
- Semi-Detached £185 K
- Terraced £159 K
- Flat/Maisonette £113 K
- Other it is £330 K
Average & Median Sales Price By District
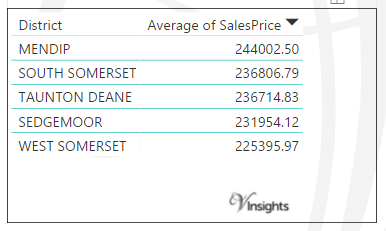
Across districts the average sales price is as above.
- It was maximum for Mendip £244 K
- South Somerset £237 K
- Taunton Deane £237 K
- Sedgemoor £232 K
- with minimum for West Somerset at £225 K
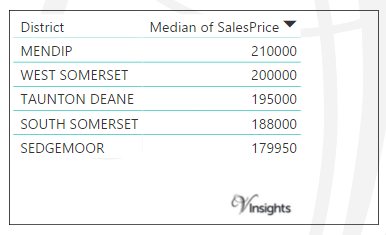
Across districts the median sales price is as above.
- It was maximum for Mendip £210 K
- West Somerset £200 K
- Taunton Deane £195 K
- South Somerset £188 K
- with minimum for Sedgemoor at £180 K
New Vs Not New Property Statistics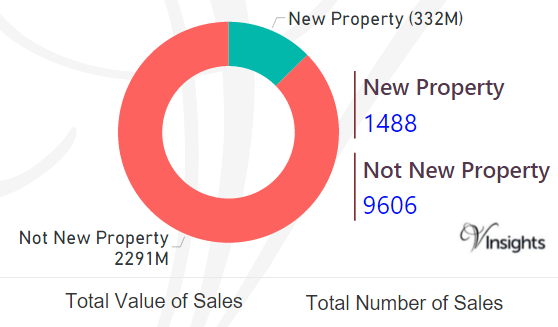
By Sales Values the split is as follows:
- New Property contributed £332 millions (12.66%)
- Not New Property contributed £2.29 billions (87.34%)
By Total Number the split is as follows:
- New properties sold were 1488 (13.41%)
- Not new property sold were 9,606 (86.59%)
All Somerset Posts
bcb47aba-c71d-4d0a-a84f-653d49fc33a3|0|.0|27604f05-86ad-47ef-9e05-950bb762570c
Story Highlights
- Poole had total property sales of £1.15 Billions in 2015
- The total number of properties sold in 2015 was 3,332 properties
- The average sales price in Poole was £345 K, whereas median was £250 K
- New Property sales was 7.11% by value, whereas Not New Property contributed 92.89%
Poole is an unitary authority council in South West England
Total Value of Sales By Property Types
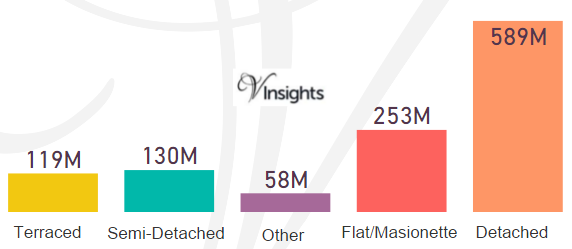
Poole had total property sales of Poole £1.15 Billions which was 3.88% of the total South West property Market in 2015.
The split across the different property types in Poole are:
- Terraced: £119 millions (10.38%)
- Semi-Detached: £130 millions (11.28%)
- Other: £58 millions (5.06%)
- Flat/Maisonette: £253 millions (22.04%)
- Detached: £589 millions (51.23%)
Total Number of Sales By Property Types
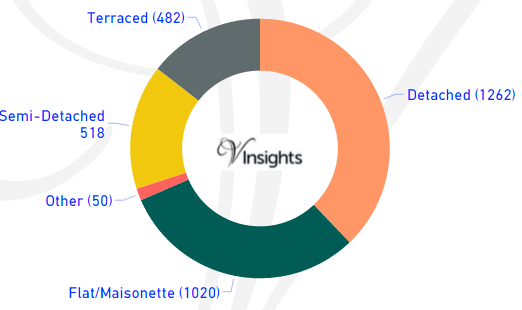
Poole had total property sales of 3,332. The split across the different property types are:
- Detached: 1,262 (37.88%)
- Flat/Maisonette: 1,020 (30.61%)
- Other: 50 (1.5%)
- Semi-Detached: 518 (15.55%)
- Terraced: 482 (14.47%)
Average & Median Sales Price
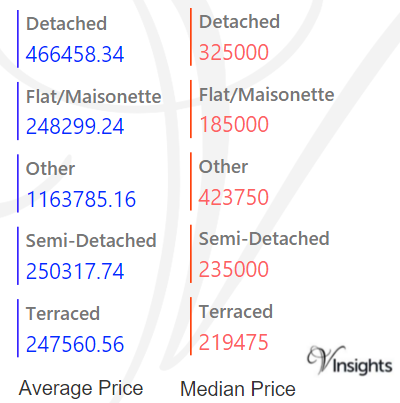
The average sales price in Poole was £345 K and for the different property types it was:
- Detached £467 K
- Semi-Detached £250 K
- Terraced £248 K
- Flat/Maisonette £248 K
- Other it is £1.16 millions
Similarly median sales price in Poole was £250 K and for the different property types it was:
- Detached: £325 K
- Semi-Detached: £235 K
- Terraced: £220 K
- Flat/Maisonette: £185 K
- Other it is £424 K
New Vs Not New Property Statistics
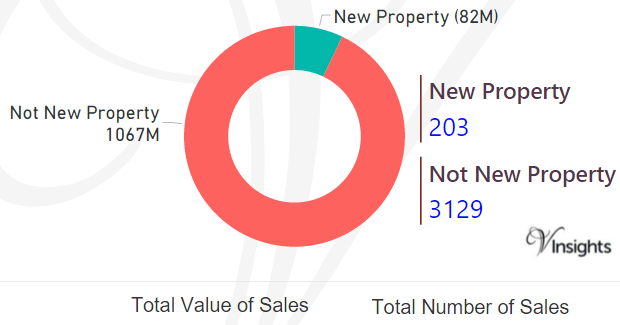
By Sales Values the split is as follows:
- New Property contributed £82 millions (7.11%)
- Not New Property contributed £1.07 billions (92.89%)
By Total Number the split is as follows:
- New properties sold were 203 (6.09%)
- Not new properties sold were 3,129 (93.91%)
All South West England Posts
084a1960-7747-4424-9189-cb69d986c4ee|0|.0|27604f05-86ad-47ef-9e05-950bb762570c