Story Highlights
- Cornwall had total property sales of £2.67 Billions in 2015
- The total number of properties sold in 2015 was 10,985
- The average sales price in Cornwall was £243 K, whereas the median was £200 K
- New Property sales were 9.51% by value, whereas Not New Property contributed 90.49%
Cornwall is an unitary authority council in South West England.
Total Value of Sales By Property Types
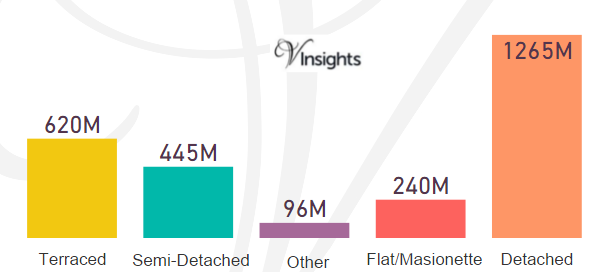
Cornwall had total property sales of £2.67 Billions which was 9% of South West property Market in 2015.
The split across the different property types in Cornwall was:
- Terraced £620 millions (23.25%)
- Semi-Detached £445 millions (16.69%)
- Other £96 millions (3.58%)
- Flat/Maisonette £240 millions (9%)
- Detached £1.27 billions (47.48%)
Total Number of Sales By Property Types
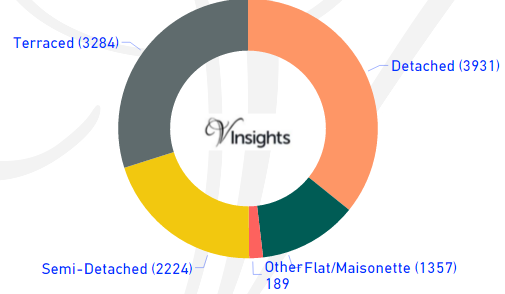
The total property sales of £2.67 Billions in 2015 was spread over 10,985 properties.
- Terraced properties was 3,284 (29.9%)
- Detached 3,931 (35.79%)
- Semi-Detached 2,224 (20.25%)
- Flat/Maisonette 1,357 (12.35%)
- Others 189 (1.72%)
Average & Median Sales Price
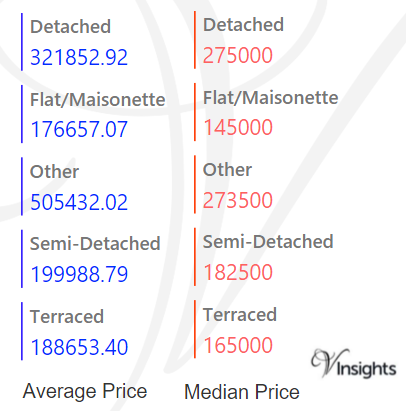
The average sales price in Cornwall was £243 K and for the different property types it was:
- Detached £322 K
- Semi-Detached £200 K
- Terraced £189 K
- Flat/Maisonette £177 K
- Other it is £505 K
Similarly median sales price in Cornwall was £200 K and for different property types it was:
- Detached £275 K
- Semi-Detached £183 K
- Terraced £165 K
- Flat/Maisonette £145 K
- Other it is £274 k
New Vs Not New Property Statistics
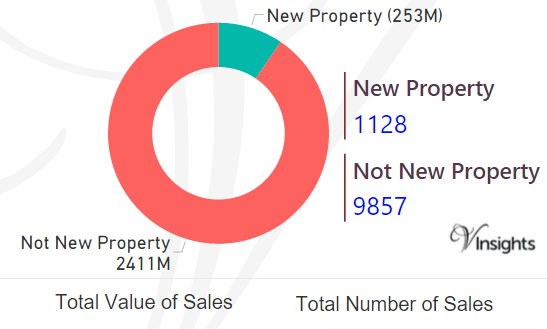
By Sales Values the split is as follows:
- New Property contributed £253 millions (9.51%)
- Not New Property contributed £2.411 billions (90.49%)
By Total Number the split is as follows:
- New properties sold were 1,128 (10.27%)
- Not new property sold were 9,857(89.73%)
All England Posts
296a1156-ef86-47fe-bd55-bf5dfdad0de8|0|.0|27604f05-86ad-47ef-9e05-950bb762570c
Story Highlights
- City of Plymouth had total property sales of £886 millions in 2015
- The total number of properties sold in 2015 was 4762
- The average sales price in City of Plymouth was £186 K, whereas median was £160 K
- New Property sales were 13.94% by value, whereas Not New Property contributed 86.06%
City of Plymouth is an unitary authority council in South West England.
Total Value of Sales By Property Types
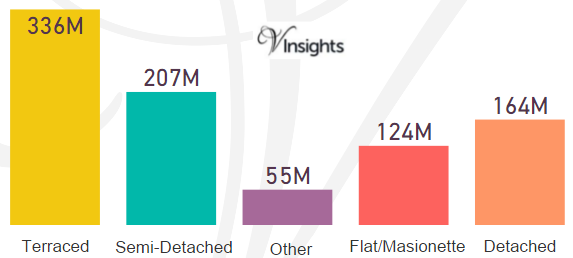
City of Plymouth had total property sales of £886 millions which was 2.99% of South West property Market in 2015.
The split across the different property types in City of Plymouth was:
- Terraced £336 millions (37.88%)
- Semi-Detached £207 millions (23.39%)
- Other £55 millions (6.24%)
- Flat/Maisonette £124 millions (13.94%)
- Detached £164 millions (18.55%)
Total Number of Sales By Property Types
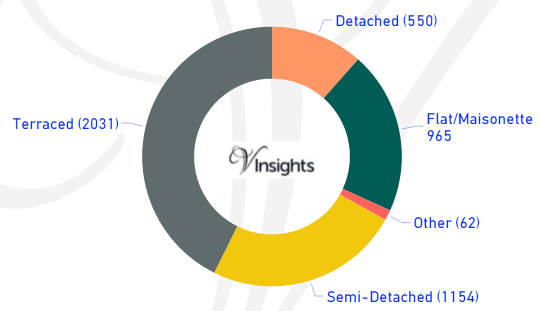
The total property sales of £886 millions in 2015 was spread over 4762 properties.
- Terraced properties was 2,031 (42.65%)
- Detached 550 (11.55%)
- Semi-Detached 1,154 (24.23%)
- Flat/Maisonette 965 (20.26%)
- Others 62 (1.3%)
Average & Median Sales Price
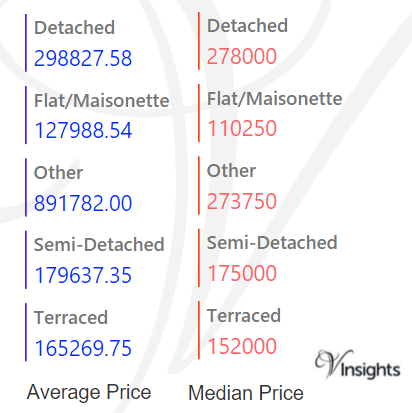
The average sales price in City of Plymouth was £186 K and for the different property types it was:
- Detached £299 K
- Semi-Detached £180 K
- Terraced £165 K
- Flat/Maisonette £128 K
- Other it is £892 K
Similarly median sales price in Bristol was £160 K and for different property types it was:
- Detached £278 K
- Semi-Detached £175 K
- Terraced £152 K
- Flat/Maisonette £110 K
- Other it is £274 k
New Vs Not New Property Statistics
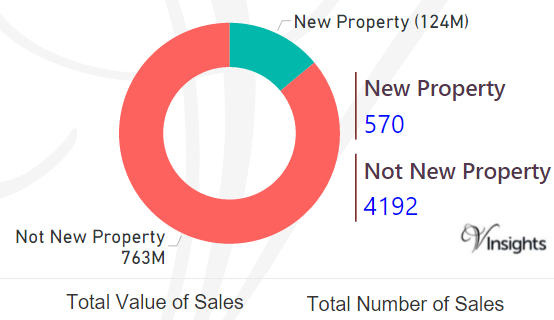
By Sales Values the split is as follows:
- New Property contributed £124 millions (13.94%)
- Not New Property contributed £763 millions (86.06%)
By Total Number the split is as follows:
- New properties sold were 570 (11.97%)
- Not new property sold were 4,192(88.03%)
All South West England Posts
0be8b540-f0da-4fed-8446-55c19155ab3d|0|.0|27604f05-86ad-47ef-9e05-950bb762570c
Story Highlights
- Bristol had total property sales of £2.44 Billions in 2015
- The total number of properties sold in 2015 was 8479
- The average sales price in Bristol was £288 K, whereas median was £215 K
- New Property sales were 5.52% by value, whereas Not New Property contributed 94.48%
Bristol is an unitary authority council in South West England.
Total Value of Sales By Property Types
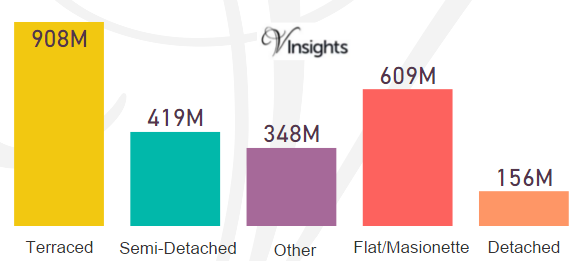
Bristol had total property sales of £2.44 Billions which was 8.24% of South West property Market in 2015.
The split across the different property types in Bristol was:
- Terraced £908 millions (37.21%)
- Semi-Detached £419 millions (17.18%)
- Other £348 millions (14.26%)
- Flat/Maisonette £609 millions (24.97%)
- Detached £156 millions (6.38%)
Total Number of Sales By Property Types
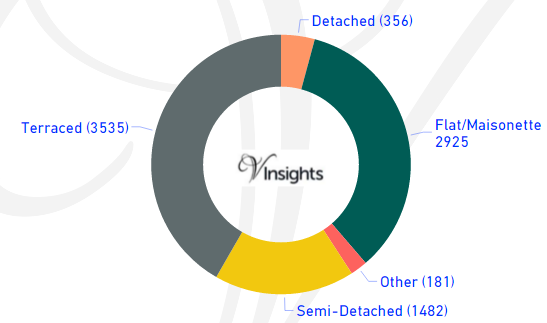
The total property sales of £2.44 Billions in 2015 was spread over 8479 properties.
- Terraced properties was 3,535 (41.69%)
- Detached 356 (4.2%)
- Semi-Detached 1,482 (17.48%)
- Flat/Maisonette 2,925 (34.5%)
- Others 181 (2.13%)
Average & Median Sales Price
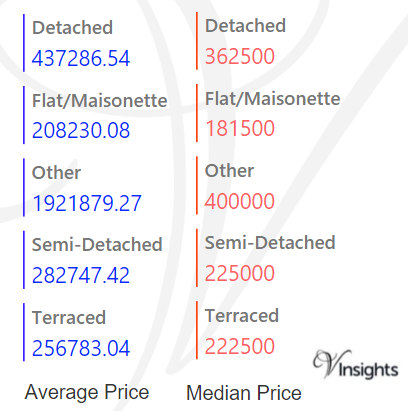
The average sales price in Bristol was £288 K and for the different property types it was:
- Detached £437 K
- Semi-Detached £283 K
- Terraced £257 K
- Flat/Maisonette £208 K
- Other it is £1.92 million
Similarly median sales price in Bristol was £215 K and for different property types it was:
- Detached £363 K
- Semi-Detached £225 K
- Terraced £223 K
- Flat/Maisonette £182 K
- Other it is £400 k
New Vs Not New Property Statistics
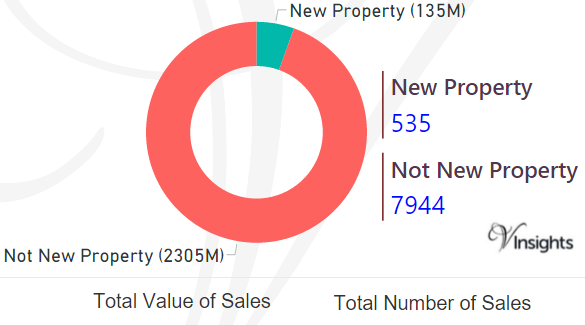
By Sales Values the split is as follows:
- New Property contributed £135 millions (5.52%)
- Not New Property contributed £2.31 billions (94.48%)
By Total Number the split is as follows:
- New properties sold were 535 (6.31%)
- Not new property sold were 7,944 (93.69%)
All England Posts
0cf2da62-2ca7-45c8-a97a-b6138d32da0c|0|.0|27604f05-86ad-47ef-9e05-950bb762570c
Story Highlights
- Bournemouth had total property sales of £1.14 Billions in 2015
- The total number of properties sold in 2015 was 4,393 properties
- The average sales price in Bournemouth was £259 K, whereas median was £220 K
- New Property sales were 6.49% by value, whereas Not New Property contributed 93.51%
Bournemouth is an unitary authority council in South West England.
Total Value of Sales By Property Types
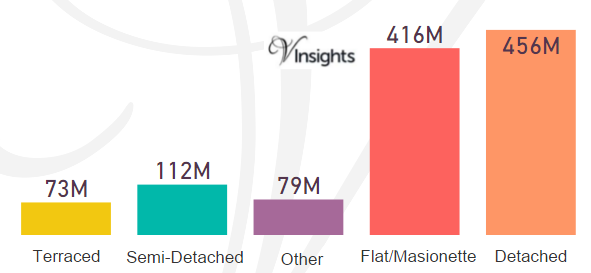
Bournemouth had total property sales of £1.14 Billions which was 3.84% of South West property Market in 2015.
The split across the different property types in Bournemouth was:
- Terraced £73 millions (6.41%)
- Semi-Detached £112 millions (9.9%)
- Other £79 millions (6.98%)
- Flat/Maisonette £416 millions (36.57%)
- Detached £456 millions (40.14%)
Total Number of Sales By Property Types
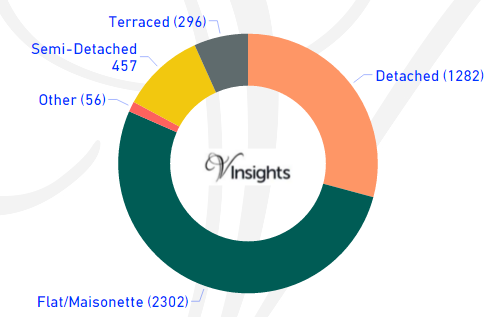
Bournemouth had total property sales of 4,393. The split across the different property types are:
- Detached 1282 (29.18%)
- Flat/Maisonette 2302(52.4%)
- Other 56 (1.27%)
- Semi-Detached 457 (10.4%)
- Terraced 296 (6.74%)
Average & Median Sales Price
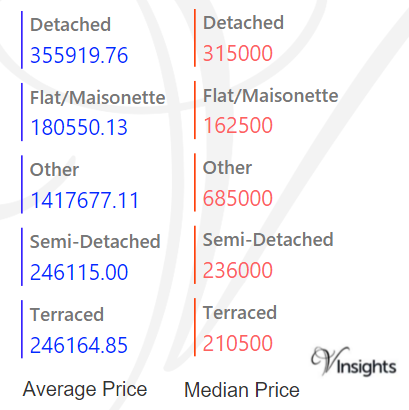
The average sales price in Bournemouth was £259 K and for the different property types it was:
- Detached £356 K
- Semi-Detached £246 K
- Terraced £246 K
- Flat/Maisonette £181 K
- Other it is £1.42 million
Similarly median sales price in Bournemouth was £220 K and for different property types are:
- Detached £315 K
- Semi-Detached £236 K
- Terraced £211 K
- Flat/Maisonette £163 K
- Other it is £685 k
New Vs Not New Property Statistics
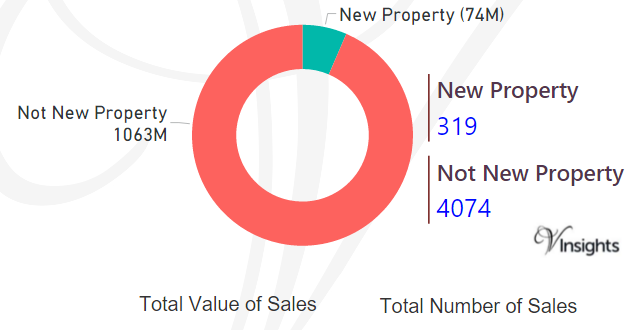
By Sales Values the split is as follows:
- New Property contributed £74 millions (6.49%)
- Not New Property contributed £1.06 billions (93.51%)
By Total Number the split is as follows:
- New properties sold were 319 (7.26%)
- Not new property sold were 4,074 (92.74%)
All England Posts
010df8f0-eaa7-4f22-a9b6-53f94b5e2c99|0|.0|27604f05-86ad-47ef-9e05-950bb762570c
Story Highlights
- Bath and North East Somerset had total property sales of £1.2 Billions in 2015
- The total number of properties sold in 2015 was 3,557 properties
- The average sales price in Bath and North East Somerset was £338 K, whereas median was £268 K
- New Property sales were 10.67% by value, whereas Not New Property contributed 89.33%
Bath and North East Somerset is an unitary authority council in South West England
Total Value of Sales By Property Types
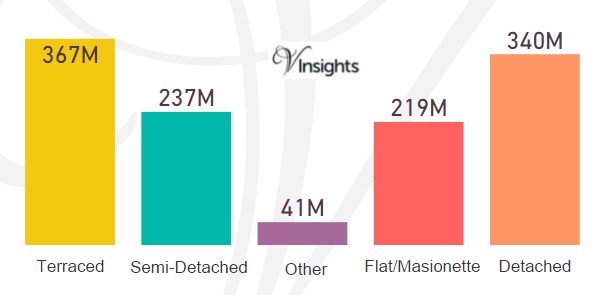
Bath and North East Somerset had total property sales of £1.2 Billions which was 4.06% of the of the total South West property Market in 2015.
The split across the different property types in Bath and North East Somerset are:
- Terraced £367 millions (30.49%)
- Semi-Detached £237 millions (19.69%)
- Other £41 millions (3.41%)
- Flat/Maisonette £219 millions (28.21%)
- Detached £340 millions (28.21%)
Total Number of Sales By Property Types
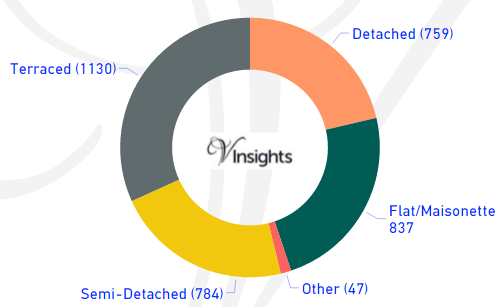
Bath and North East Somerset had total property sales of 3,557. The split across the different property types are:
- Detached 759 (21.34%)
- Flat/Maisonette 837(23.53%)
- Other 47 (1.32%)
- Semi-Detached 784 (22.04%)
- Terraced 1130 (31.77%)
Average & Median Sales Price
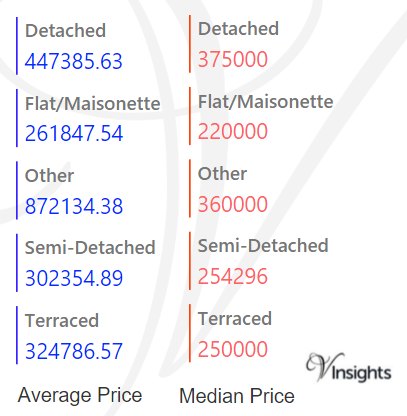
The average sales price in Bath and North East Somerset was £338 K and for the different property types it was:
- Detached £447 K
- Semi-Detached £302 K
- Terraced £325 K
- Flat/Maisonette £262 K
- Other it is £872 K
Similarly median sales price in Bath and North East Somerset was £268 K and for the different property types it was:
- Detached £375 K
- Semi-Detached £254 K
- Terraced £250 K
- Flat/Maisonette £220 K
- Other it is £360 K
New Vs Not New Property Statistics
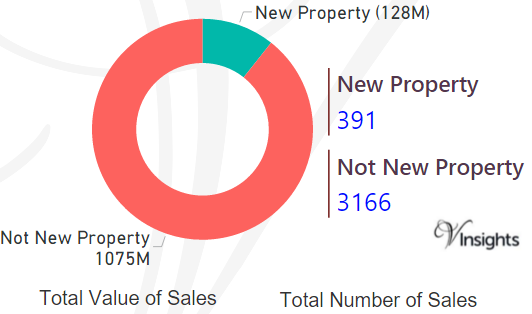
By Sales Values the split is as follows:
- New Property contributed £128 millions (10.67%)
- Not New Property contributed £1.08 billions (89.33%)
By Total Number the split is as follows:
- New properties sold were 391 (10.99%)
- Not new property sold were 3,166(89.01%)
All England Posts
99124f66-04f3-4f5a-a847-c05488ae3209|0|.0|27604f05-86ad-47ef-9e05-950bb762570c