Story Highlights
- North Somerset had total property sales of £1.19 Billions in 2015
- The total number of properties sold in 2015 was 4,639
- The average sales price in North Somerset was £255 K, whereas median was £211 K
- New Property sales were 7.86% by value, whereas Not New Property contributed 92.14%
North Somerset is an unitary authority council in South West England
Total Value of Sales By Property Types
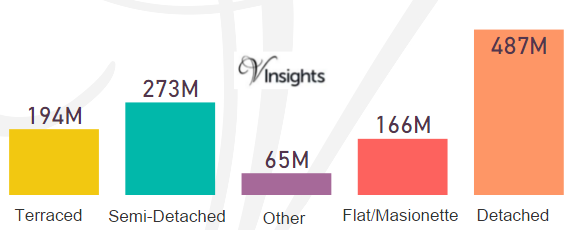
North Somerset had total property sales of £1.19 Billions which was 4% of the total South West property Market in 2015.
The split across the different property types in North Somerset are:
- Terraced: £194 millions (16.39%)
- Semi-Detached: £273 millions (23.03%)
- Other: £65 millions (5.46%)
- Flat/Maisonette: £166 millions (14%)
- Detached: £487 millions (41.12%)
Total Number of Sales By Property Types
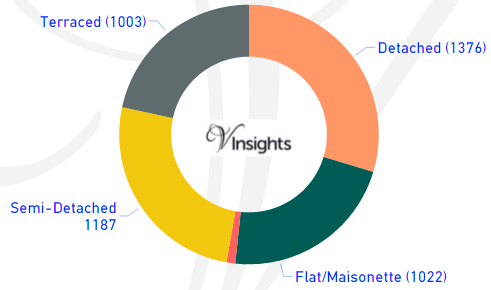
North Somerset had total property sales of 4,639. The split across the different property types are:
- Detached: 1,376 (29.66%)
- Flat/Maisonette: 1,022(22.03%)
- Other: 51 (1.1%)
- Semi-Detached: 1,187 (25.59%)
- Terraced: 1,003 (21.62%)
Average & Median Sales Price
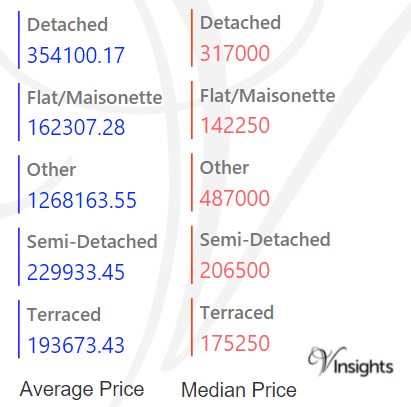
The average sales price in North Somerset was £255 K and for the different property types it was:
- Detached: £354 K
- Semi-Detached: £230 K
- Terraced: £194 K
- Flat/Maisonette: £162 K
- Other it is £1.27 millions
Similarly median sales price in North Somerset was £211 K and for the different property types it was:
- Detached: £317 K
- Semi-Detached: £207 K
- Terraced: £175 K
- Flat/Maisonette: £142 K
- Other it is £487 K
New Vs Not New Property Statistics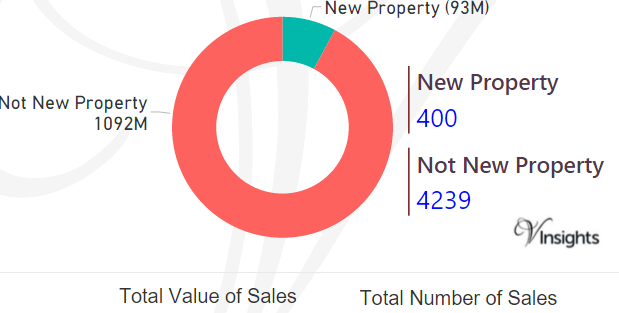
By Sales Values the split is as follows:
- New Property contributed £93 millions (7.86%)
- Not New Property contributed £1.09 billions (92.14%)
By Total Number the split is as follows:
- New properties sold were 400 (8.62%)
- Not new property sold were 4,239 (91.38%)
All South West England Posts

e2a52361-2b42-474c-b428-d89ac46a86ae|0|.0|27604f05-86ad-47ef-9e05-950bb762570c
Story Highlights
- Isle of Scilly had total property sales of £6.4 millions in 2015
- The total number of properties sold in 2015 was 19
- The average sales price in Isle of Scilly was £340 K whereas median was £275 K
- Not New Property contributed 100% of the sales value
Isle of Scilly is an unitary authority council in South West England
Total Value of Sales By Property Types
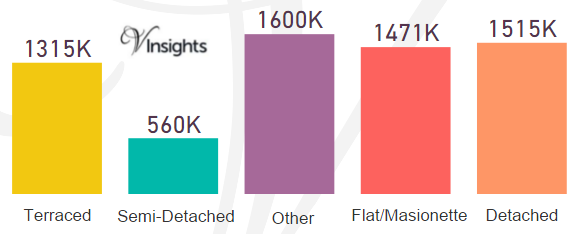
Isle of Scilly had total property sales of £6.4 millions and is part of South West property Market in 2015.
The split across the different property types in Isle of Scilly are:
- Terraced £1.32 millions (20.35%)
- Semi-Detached £560 K (8.67%)
- Other £1.6 millions (24.77%)
- Flat/Maisonette £1.47 millions (22.77%)
- Detached £1.52 millions (23.44%)
Total Number of Sales By Property Types
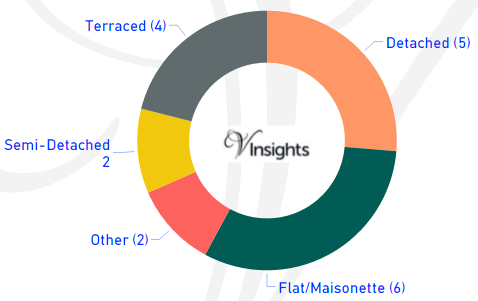
Isle of Scilly had total property sales of 19. The split across the different property types are:
- Detached: 5 (26.32%)
- Flat/Maisonette: 6 (31.58%)
- Other: 2 (10.53%)
- Semi-Detached: 2 (10.53%)
- Terraced: 4 (21.05%)
Average & Median Sales Price
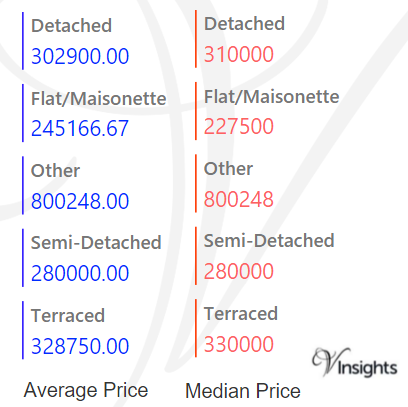
The average sales price in Isle of Scilly was £340 K and for the different property types it was:
- Detached: £303 K
- Semi-Detached: £280 K
- Terraced: £329 K
- Flat/Maisonette: £245 K
- Other it is £800 K
Similarly median sales price in Isle of Scilly was £275 K and for the different property types it was:
- Detached: £310 K
- Semi-Detached: £280 K
- Terraced: £330 K
- Flat/Maisonette: £228 K
- Other it is £800 K
New Vs Not New Property Statistics
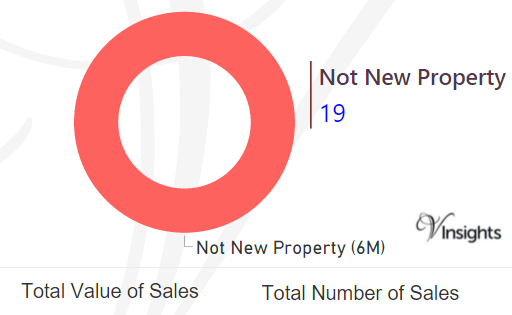
The sales value contributed only by Not New Property: £6.46 millions (100%).
Not new properties sold were 19 (100%).
All South West England Posts
6bcb80a8-02ae-46b6-b905-6f05f8f2b597|0|.0|27604f05-86ad-47ef-9e05-950bb762570c
Story Highlights
- Gloucestershire had total property sales of £3.5 Billions in 2015
- Across its districts Cheltenham had maximum sales of £807 millions and minimum for Forest of Dean at £296 millions.
- The total number of properties sold in 2015 was 12,551
- The average sales price in Gloucestershire was £277 K, whereas the median was £211 K
- Across its districts average sales price in Gloucestershire was maximum for Cotswold at £408 K and was minimum for Gloucester at £190 K
- Similarly the median sales price in Gloucestershire was maximum for Cotswold at £310 K and was minimum for Gloucester at £165 K
- New Property sales were 11.69% by sales value, whereas Not New Property contributed 88.31%
Gloucestershire is one of the counties of South West England. The districts of Gloucestershire are Cheltenham, Cotswold, Stroud, Teweksbury, Gloucester, Forest of Dean. Let us look at Gloucestershire Property Market 2015 in detail.
Total Value of Sales By Property Types
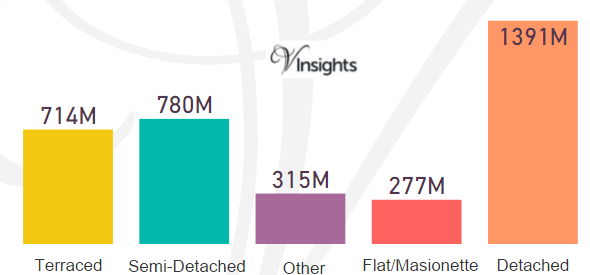
Gloucestershire had total property sales of Gloucestershire £3.5 Billions which was 11.74% of the total South West property Market in 2015 and was second highest across all the counties in South West England.
The split across the different property types in Gloucestershire are:
- Terraced: £714 millions (20.53%)
- Semi-Detached: £780 millions (22.44%)
- Other: £315 millions (9.07%)
- Flat/Maisonette: £277 millions (7.96%)
- Detached: £1.39 billions (40.01%)
Total Sales By Districts
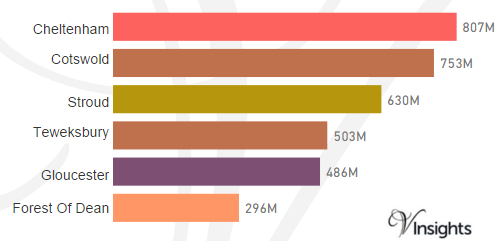
The split of the £3.5 Billions sales in Gloucestershire across the different districts is as above.
- It was maximum for Cheltenham at £807 millions (23.21%)
- Cotswold at £753 millions (21.67%)
- Stroud: £630 millions (18.13%)
- Teweksbury: £503 millions (14.48%)
- Gloucester: £486 millions (13.99%)
- with minimum for Forest of Dean at £296 millions (8.52%)
Total Number of Sales By Property Types
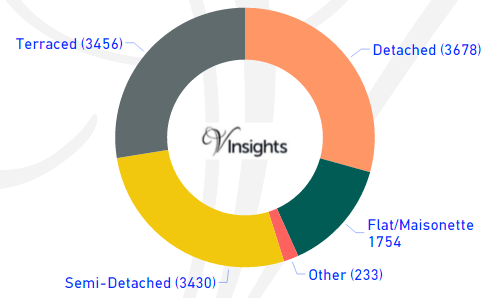
Gloucestershire had total number property sales of 12,551. The split across the different property types are:
- Detached: 3,678 (29.3%)
- Flat/Maisonette: 1,754 (13.97%)
- Other: 233 (1.86%)
- Semi-Detached: 3,430 (27.33%)
- Terraced: 3,456 (27.54%)
Average & Median Sales Price
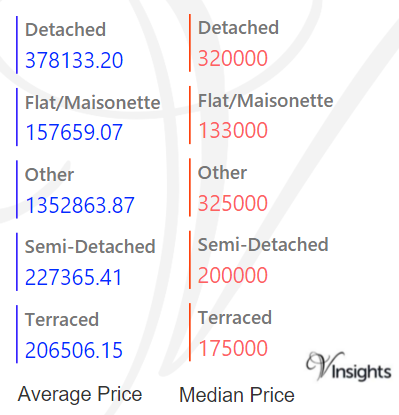
The average sales price in Gloucestershire was £277 K and for the different property types it was:
- Detached: £378 K
- Semi-Detached: £227 K
- Terraced: £207 K
- Flat/Maisonette: £158 K
- Other it is £1.35 millions
Similarly the median sales price in Gloucestershire was £211 K and for the different property types it was:
- Detached: £320 K
- Semi-Detached: £200 K
- Terraced: £175 K
- Flat/Maisonette: £133 K
- Other it is £325 K
Average & Median Sales Price By District
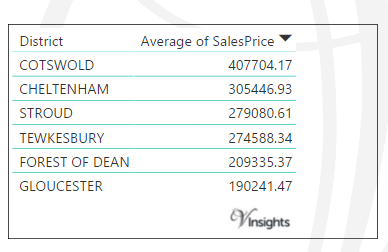
Across districts the average sales price is as above.
- Maximum average price was for Cotswold at £408 K
- Cheltenham at £305 K
- Stroud £279K
- Tewkesbury £275K
- Forest of Dean at £209 K
- with minimum for Gloucester at £190 K
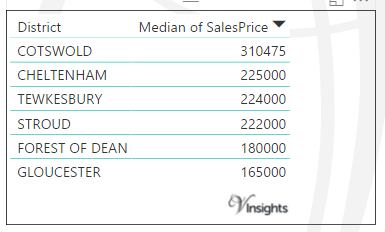
Across districts the median sales price is as above.
- Maximum median price was for Cotswold at £310 K
- Cheltenham at £225 K
- Tewkesbury £224K
- Stroud £222 K
- Forest of Dean at £180 K
- with minimum for Gloucester at £165 K
New Vs Not New Property Statistics
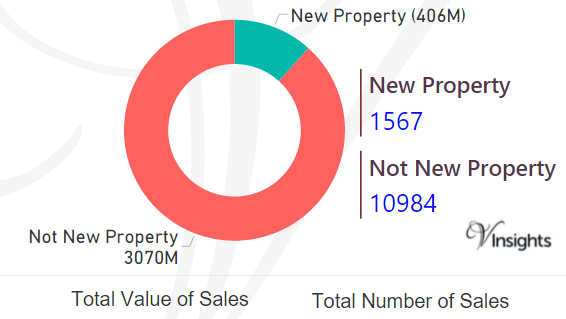
By Sales Values the split is as follows:
- New Property contributed £406 millions (11.69%)
- Not New Property contributed £3.07 billions (88.31%)
By Total Number the split is as follows:
- New properties sold were 1,567 (12.49%)
- Not new properties sold were 10,984(87.51%)
All Gloucestershire Posts
a9a27bfd-2259-41e4-896b-47245cabeb84|0|.0|27604f05-86ad-47ef-9e05-950bb762570c
Story Highlights
- Dorset had total property sales of £2.64 Billions in 2015
- Across its districts East Dorset has maximum sales of £653 millions and minimum for Purbeck at £273 millions.
- The total number of properties sold in 2015 was 8,834
- The average sales price in Dorset was £299 K, whereas the median was £260 K
- Across its districts average sales price in Dorset was maximum for East Dorset at £346 K and was minimum for Weymouth and Portland at £225 K
- Similarly the median sales price in Dorset was maximum for East Dorset at £307 K and was minimum for Weymouth and Portland at £195 K
- New Property sales were 6.84% by sales value, whereas Not New Property contributed 93.16%
Dorset is one of the counties of South West England. The districts of Dorset are East Dorset, West Dorset, Christchurch, North Dorset, Weymouth and Portland, Purbeck. Let us look at Dorset Property Market 2015 in detail.
Total Value of Sales By Property Types
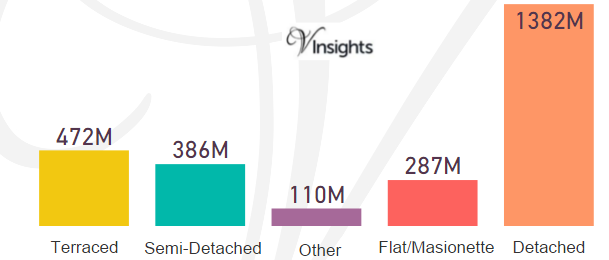
Dorset had total property sales of £2.64 Billions which was 8.91%% of the total South West property Market in 2015 and was fifth highest across all the counties in South West England.
The split across the different property types in Dorset are:
- Terraced £472 millions (17.89%)
- Semi-Detached £386 millions (14.64%)
- Other £110 millions (4.18%)
- Flat/Maisonette £287 millions (10.89%)
- Detached £1.38 billions (52.39%)
Total Sales By Districts
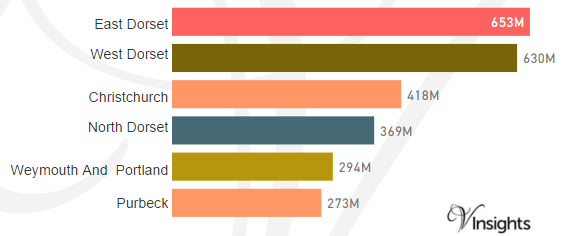
The split of the £2.64 Billions sales in Dorset across the different districts is as above.
- It was maximum for East Dorset £653 millions (24.77%)
- West Dorset £630 millions (23.88%)
- Christchurch £418 millions (15.86%)
- North Dorset £369 millions (14%)
- Weymouth and Portland £294 millions (11.14%)
- with minimum for Purbeck at £273 millions (10.34%)
Total Number of Sales By Property Types
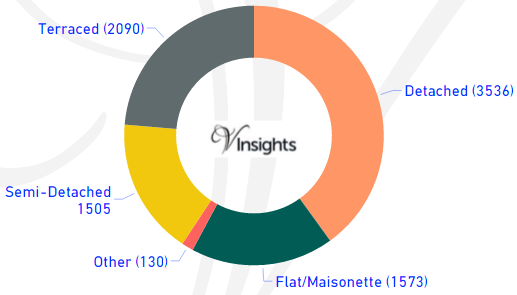
Dorset had total number property sales of 8,834. The split across the different property types are:
- Detached 3,536 (40.03%)
- Flat/Maisonette 1,573 (17.81%)
- Other 130 (1.47%)
- Semi-Detached 1,505 (17.04%)
- Terraced 2,090 (23.66%)
Average & Median Sales Price
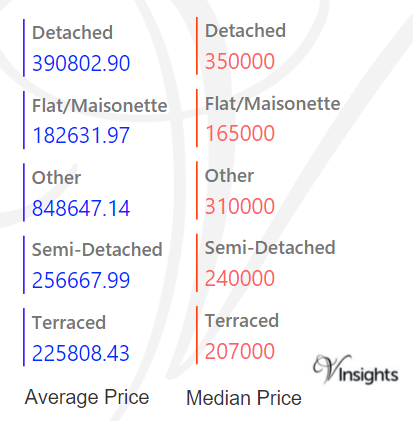
The average sales price in Dorset was £299 K and for the different property types it was:
- Detached £391 K
- Semi-Detached £257 K
- Terraced £226 K
- Flat/Maisonette £183 K
- Other it is £849 K
Similarly median sales price in Dorset was £260 K and for the different property types are:
- Detached £350 K
- Semi-Detached £240 K
- Terraced £207 K
- Flat/Maisonette £165 K
- Other it is £310 K
Average & Median Sales Price By District
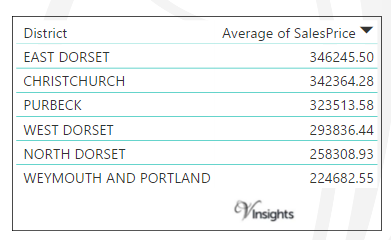
Across districts the average sales price is as above.
- It was maximum for East Dorset £346 K
- followed by Christchurch £342 K
- Purbeck £324 K
- West Dorset £294 K
- North Dorset £258 K
- with minimum for Weymouth and Portland at £225 K
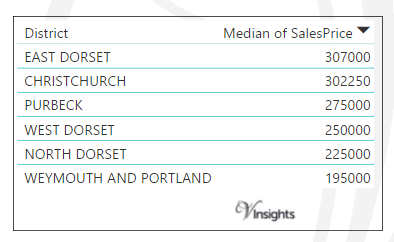
Across districts the median sales price is as above.
- It was maximum for East Dorset at £307 K
- followed by Christchurch £302 K
- Purbeck £275 K
- West Dorset £250 K
- North Dorset £225 K
- with minimum for Weymouth and Portland at £195 K
New Vs Not New Property Statistics
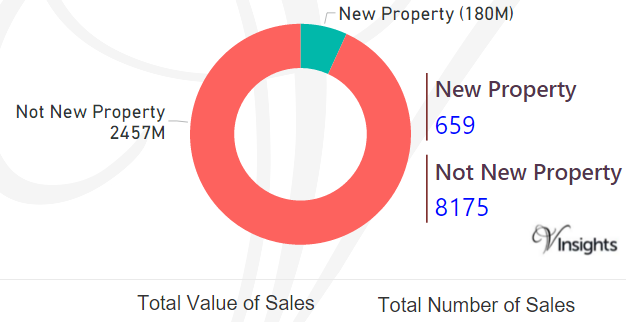
By Sales Values the split is as follows:
- New Property contributed £180 millions (6.84%)
- Not New Property contributed £2.46 billions (93.16%)
By Total Number the split is as follows:
- New properties sold were 659 (7.46%)
- Not new property sold were 8,175(92.54%)
All South West England Posts
dc61fa2e-ad77-471c-8249-a56902c0e9af|0|.0|27604f05-86ad-47ef-9e05-950bb762570c
Story Highlights
- Devon had total property sales of £4.4 Billions in 2015
- The total number of properties sold in 2015 was 16,511
- The average sales price in Devon was £266 K, whereas the median was £223 K
- Across its districts average sales price in Devon was maximum for South Hams at £327 K and was minimum for Torridge at £230 K
- Similarly the median sales price in Devon was maximum for South Hams at £270 K and was minimum for Torridge at £198 K
- New Property sales were 11.6% by sales value, whereas Not New Property contributed 88.4%
Devon is one of the counties of South West England. The districts of Devon are East Devon, Exeter, Teignbridge, South Hams, North Devon, Torridge, Mid Devon, West Devon. Let us look at Devon Property Market 2015 in detail.
Total Value of Sales By Property Types
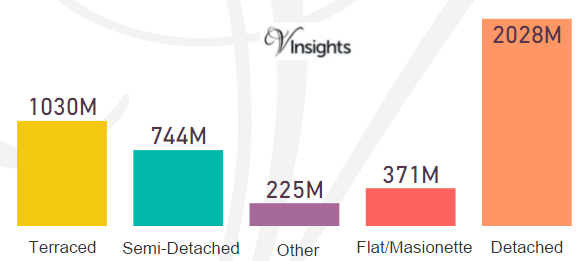
Devon had total property sales of £4.4 Billions which was 14.85% of the total South West property Market in 2015 and was highest across all the counties in South West England.
The split across the different property types in Devon are:
- Terraced £1.03 billions (23.42%)
- Semi-Detached £744 millions (16.92%)
- Other £225 millions (5.11%)
- Flat/Maisonette £371 millions (8.44%)
- Detached £2.03 billions (46.11%)
Total Sales By Districts
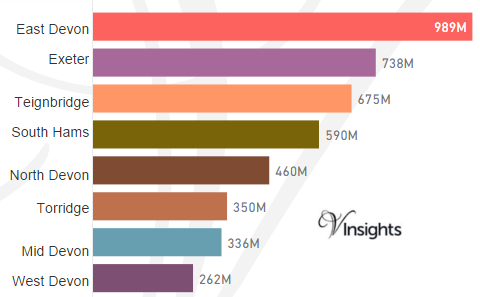
The split of the £4.4 Billions sales in Devon across the different districts was:
- East Devon £989 millions (22.49%)
- Exeter £738 millions (16.77%)
- Teignbridge £675 millions (15.33%)
- South Hams £590 millions (13.41%)
- North Devon £460 millions (10.46%)
- Torridge £350 millions (7.96%)
- Mid Devon £336 millions (7.63%)
- West Devon £262 millions (5.95%)
Total Number of Sales By Property Types
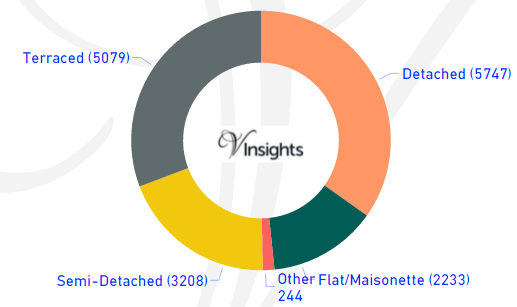
Devon had total number property sales of 16,511. The split across the different property types are:
- Detached 5747 (34.81%)
- Flat/Maisonette 2233 (13.52%)
- Other 244 (1.48%)
- Semi-Detached 3208 (19.43%)
- Terraced 5079 (30.76%)
Average & Median Sales Price
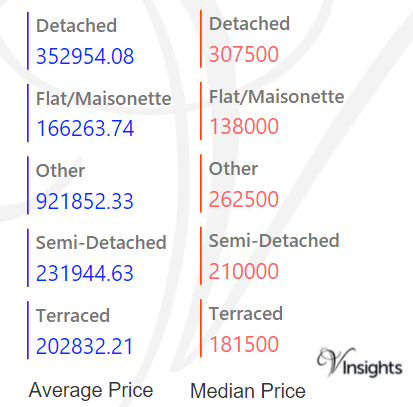
The average sales price in Devon was £266 K and for the different property types it was:
- Detached £353 K
- Semi-Detached £232 K
- Terraced £203 K
- Flat/Maisonette £166 K
- Other it is £922 K
Similarly median sales price in Devon was £223 K and for different property types are:
- Detached £308 K
- Semi-Detached £210 K
- Terraced £182 K
- Flat/Maisonette £138 K
- Other it is £263 k
Average & Median Sales Price By District
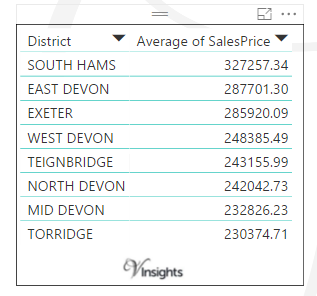
Across it districts the average sales price is as above.
- South Hams has the highest average sales price at £327 K
- East Devon at £287 K
- Exeter £286 K
- West Devon £248 K
- Teignbridge £243 K
- North Devon £242 K
- Mid Devon £233 K
- with minimum for Torridge at £230 K
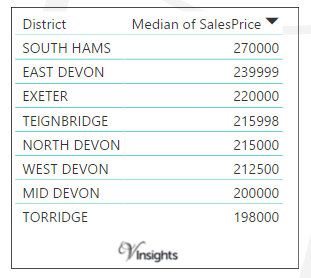
Across it districts the median of sales price is as above.
- South Hams has the highest median sales price at £270 K
- East Devon at £240 K
- Exeter £220 K
- Teignbridge £216 K
- North Devon £215 K
- West Devon £213 K
- Mid Devon £200 K
- with minimum for Torridge at £198 K
New Vs Not New Property Statistics
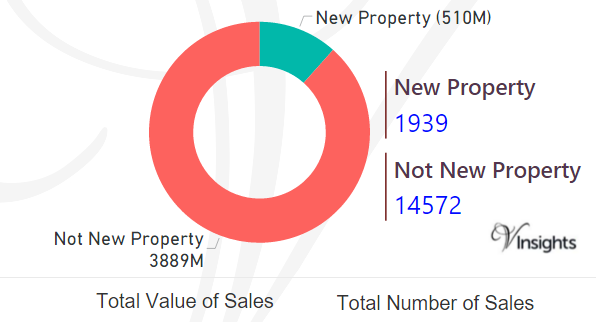
By Sales Values the split is as follows:
- New Property contributed £510 millions (11.6%)
- Not New Property contributed £3.9 billions (88.4%)
By Total Number the split is as follows:
- New properties sold were 1,939 (11.74%)
- Not new property sold were 14,572(88.26%)
All Posts on Devon
bfca88ee-d493-473a-8d7e-6cae7e01590d|0|.0|27604f05-86ad-47ef-9e05-950bb762570c