For 2016 details - South East England Property Market 2016
Story Highlights
- South East had total property sales of £61 Billions in 2015
- Total Sales By county was maximum in Surrey at £11.16 Billions
- The total number of properties sold in 2015 was 174,172 properties
- The average sales price in South East was £352 K whereas median was £270 K
- The average sales price in South East at County level was maximum for Surrey at £504 K and was minimum for Isle Of Wight at £219 K.
- New Property sales were 9.53% by value where as Not New Property contributed 90.47%
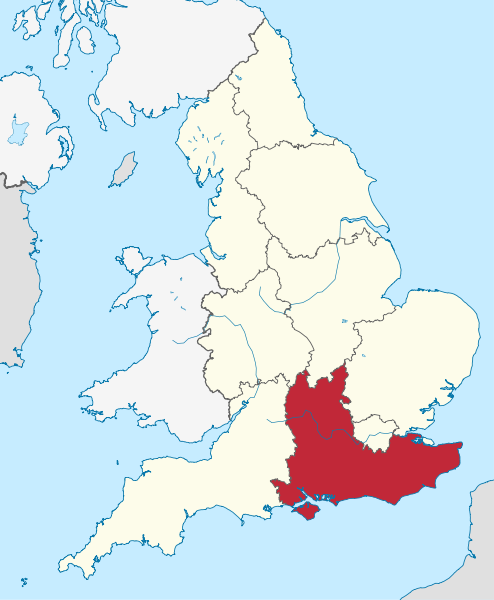
South East is one of the 9 principal areas of England. South East England counties are Berkshire, Buckinghamshire, Milton Keynes, East Sussex, Brighton & Hove,Hampshire, Southampton, Portsmouth, Isle Of Wight, Kent, Medway, Oxfordshire, Surrey and West Sussex. It is the most populous of the nine regions of England.
Total Value of Sales By Property Types
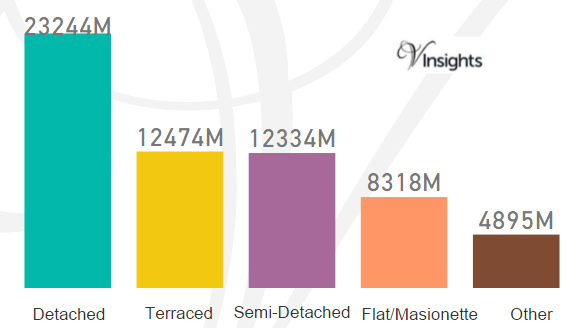
South East had total property sales of £61 Billions. It contributed 20.75% of the England and Wales Property Market 2015.
The split across the different property types was
- Detached at £23.24 Billions (37.94%)
- Terraced at £12.47 Billions (20.36%)
- Semi-Detached at £12.33 Billions (20.13 %)
- Flat/Masionette at £8.32 Billions (13.58%)
- Other at 4.9 billions (7.99%)
Total Sales By County
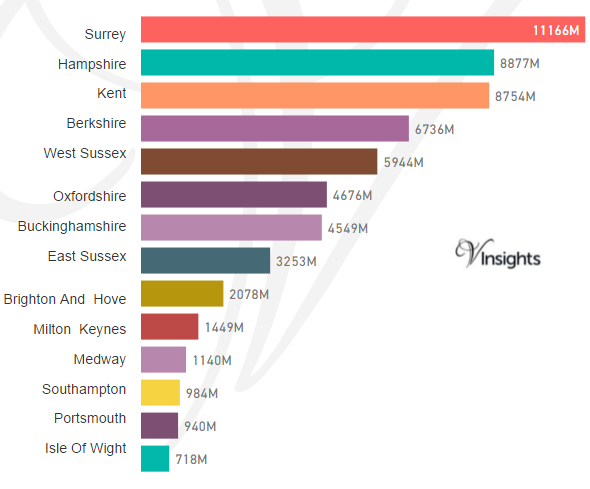
The total sales of £61 billions in 2015 was split across its counties as above.
Total Number of Sales By Property Types
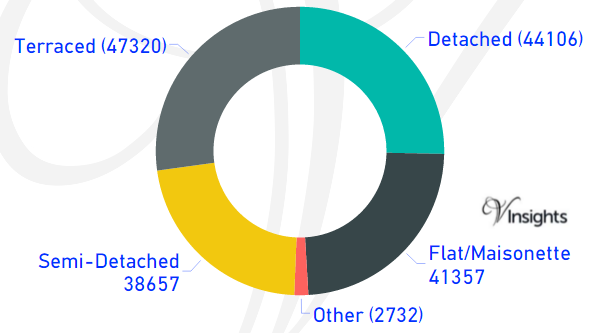
The total property sales of £61 Billions in 2015 was spread over 174,172 properties.
- Terraced properties at 47,320 (27.17%)
- Detached at 44,109 (25.32%)
- Semi-Detached at 38,657 ( 22.19%)
- Flat/Maisonette at 41,357 (23.74%)
- Others at 2,732 (1.57%)
Average & Median Sales Price
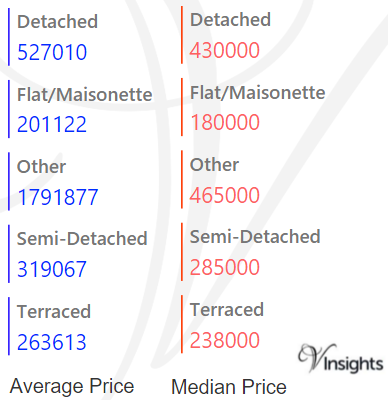
The average sales price in South East was £352 K. For the different property types it was
- Detached at £527 K
- Semi-Detached at £319 K
- Terraced at £264 K
- Flat/Maisonette at £201 K
- Other it is at £1.79 million.
Similarly median sales price in South East was £270 K. For different property types it was
- Detached at £430 K
- Semi-Detached at £285 K
- Terraced at £238 K
- Flat/Maisonette at £180 K
- Other it is at £465 K
Average & Median Sales Price By County
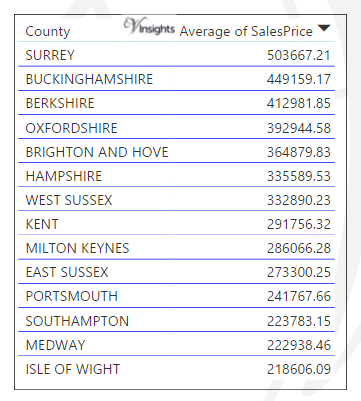
The average sales price in South East in 2015 is as above.
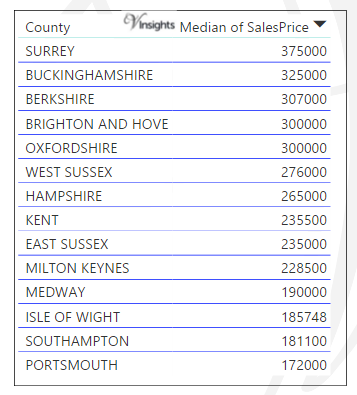
The median sales price in South East in 2015 is as above.
New Vs Not New Property Statistics
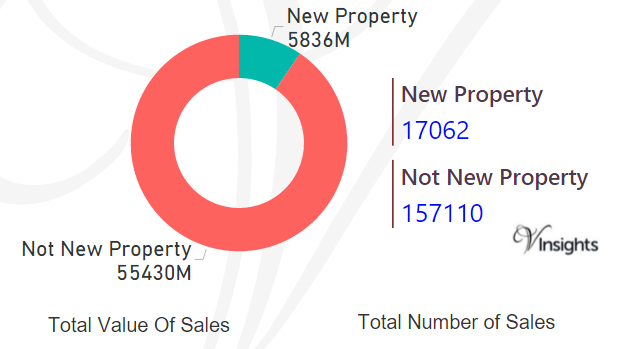
By Value Of Sales
- The sales value contributed by New Property was £5.836 billions (9.53%)
- where as Not New Property contribute £55.43 billions (90.47 %)
By Number Of Sales
- New properties sold were 17,062 (9.8%)
- where as not new property sold were 157,110 (90.2%)
All England Posts

41f3e6d4-2c9a-43b6-9a68-9428aaec4ef4|0|.0|27604f05-86ad-47ef-9e05-950bb762570c