Story Highlights
- Berkshire had total property sales of £6.6 Billions in 2016
- Across the districts maximum sales was in Windsor and Maidenhead at £1.49 billions
- The total number of properties sold in 2016 was 14,483 properties
- The average sales price in Berkshire was £453 K, whereas median was £340 K
- Across its districts average sales price was maximum for Windsor And Maidenhead at £651 K
- New Property sales were 9.87% by value, where as Not New Property contributed 90.13%
- Stamp duty changes caused monthly spike in March
- Brexit coupled with Stamp Duty Hike caused decline of 2.08% in 2016 over 2015
Berkshire is one of the counties of South East England. The districts of Berkshire are Wokingham, Windsor and Maidenhead, Reading, West Berkshire, Bracknell Forest, Slough. Let us look at the Berkshire Property Market for 2016 in detail.
Total Sales By Districts
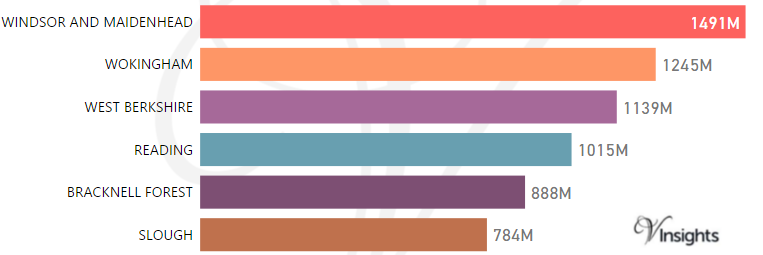
Berkshire had total property sales of £6.6 Billions which was 10.6% of the total South East property market in 2016.
The split of the sales across the different districts was:
Year on Year Comparison : Compared to Berkshire Property Market 2015 in 2016
Month-wise Break-up of Total Sales
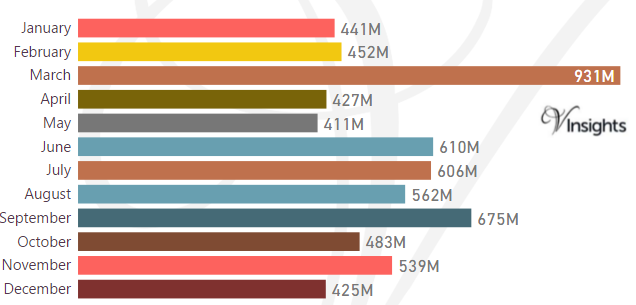
Some of the insights based on the £6.6 Billions month-wise break-down :
Stamp Duty Hike Impact
- March had property sale spike of £931 millions compared to £452 millions in Feb
- The impetus for it was to avoid the extra 3% in Stamp Duty Tax applicable on buying an additional home, being applicable from April 1 2016
Brexit Impact
- Brexit took place on 23rd June 2016.
- As can be observed from the month-wise break-up there does not seem to have been dip in property sales in the immediate after-math of Brexit
- Year on Year decline has been 2.08%
Total Sales By Property Type
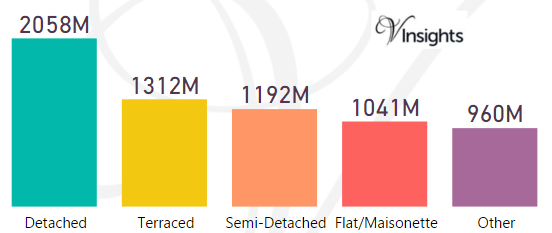
The split across the different property types in Berkshire are:
- Detached £2.06 billions (31.36%)
- Terraced £1.31 billions (20%)
- Semi-Detached £1.19 billions (18.17%)
- Flat/Maisonette £1.04 billions (15.86%)
- Other £960 millions (14.62%)
Year on Year Comparison : Compared to Berkshire Property Market 2015 in 2016
- All property types have shown decline in property sales except Flat/Maisonette, Other
- Other had significant growth of 8.7% over 2015
Total No Of Properties Sold By Property Type
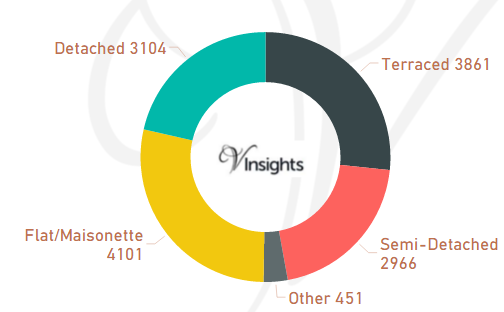
Berkshire had total property sales of 14,483. The split across the different property types are:
- Flat/Maisonette 4101 (28.32%)
- Terraced 3861 (26.66%)
- Detached 3104 (21.43%)
- Semi-Detached 2966 (20.48%)
- Other 451 (3.11%)
Year on Year Comparison : Compared to Compared to Berkshire Property Market 2015 in 2016
- Total number of property sales in 2016 has decreased by 11.21%
- All property types have shown decline in number of properties sold except property type Other.
- Other has shown significant increase of 77.6%
Average & Median Sales Price
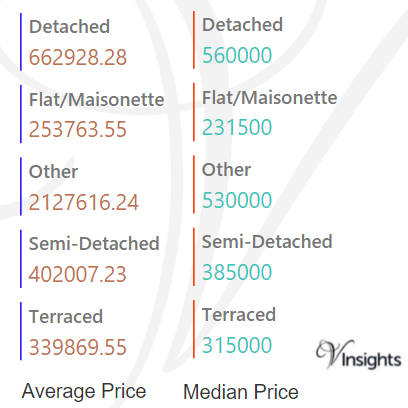
The average sales price in Berkshire was £453 K and for the different property types it was:
- Detached £663 K
- Semi-Detached £402 K
- Terraced £340 K
- Flat/Maisonette £254 K
- Other it is £2.13 million
Similarly median sales price in Berkshire was £340 K and for different property types are:
- Detached £560 K
- Semi-Detached £385 K
- Terraced £315 K
- Flat/Maisonette £232 K
- Other it is £530 k
Year on Year Comparison : Compared to Berkshire Property Market 2015 in 2016
- The average and median property prices have gone up except for property type Other
- Other has had decline in average and median property price
Average & Median Sales Price By Districts
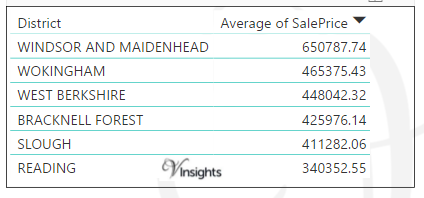
Across districts the average sales price is as above.
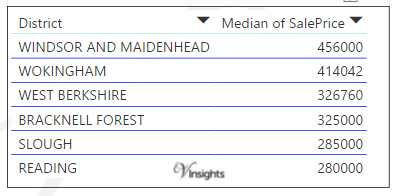
Across districts the median sales price is as above.
Year on Year Comparison : Compared to Berkshire Property Market 2015 in 2016
- The average sales price across all the counties have gone up except for Wokingham, Reading
- The median sales price across all the counties have gone up
New Vs Not New Property Statistics
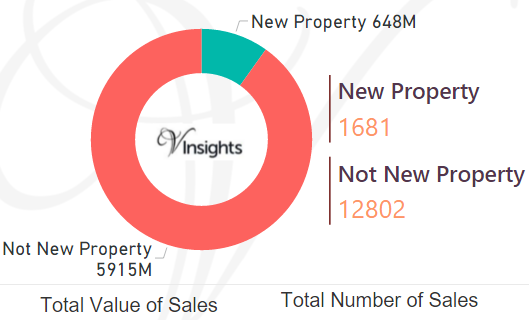
By Sales Values the split is as follows:
- New Property contributed £648 millions (9.87%)
- Not New Property contributed £5.9 billions (90.13%)
By Total Number the split is as follows:
- New properties sold were 1,681 (11.61%)
- Not new property sold were 12,802(88.39%)
Year on Year Comparison : Compared to Berkshire Property Market 2015 in 2016
- New property market share in property market has gone up in 2016 over 2015
All Berkshire Posts

13038ac2-16df-4247-bdbb-1e7c8f181b83|0|.0|27604f05-86ad-47ef-9e05-950bb762570c