For 2016 details - Enfield Property Market 2016
Story Highlights
- Enfield had total Property Sales of £1.77 billions in 2015.
- The total number of properties sold in year 2015 was 4169.
- The Average property price was £424 K in Enfield while Median was was £320 K.
- Not New Property contributed 96.64% and New Property 3.36% by sales value
Total Sales By Property Type
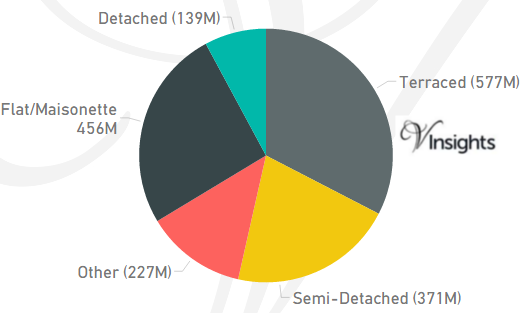
Enfiled is one of the Boroughs of North London. It had total Property Sales of £1.77 billions which was 25.35 % of North London Property Market 2015.
The split across the different property types are:
- Terraced £577 millions (32.59%)
- Semi-Detached £371 millions (20.94%)
- Other £227 millions (12.83%)
- Flat/Maisonette £456 millions (25.77%)
- Detached £139 millions (7.87%)
Total No Of Properties Sold By Property Type
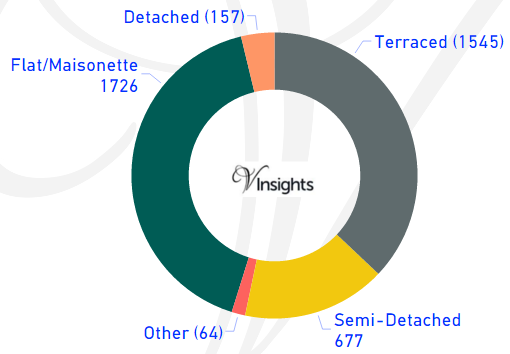
In Enfiled the total number of properties sold in year 2015 was 4169. The breakdown by different property types are:
- Terraced 1545 (37.06%)
- Semi-Detached 677 (16.24%)
- Other 64 (1.54%)
- Flat/Maisonette 1726 (41.4%)
- Detached 157 (3.77%)
Average & Median Sales Price
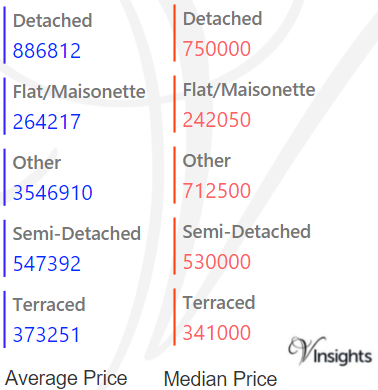
In 2015 the Average property price was £424 K in Enfield. The average price for the different property types are:
- Detached £887 K
- Flat/Maisonette £264 K
- Other £3.55 millions
- Semi-Detached £547 K
- Terraced £373 K
The Median Price was £320 K. The median property price for the different property types are:
- Detached £750 K
- Flat/Maisonette £242 K
- Other £713 K
- Semi-Detached £530 K
- Terraced £341 K
New Vs Not New Property Statistics
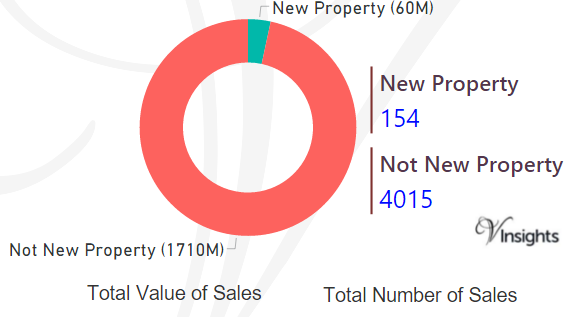
By Value Of Sales
- Not New Property contributed £1.71 billion (96.64%)
- New Property 60 millions (3.36%) giving combined total of £1.77 billions.
By Number Of Sales
- The number of Not New Property sold was 4015 (96.31%)
- The number of New Property sold was 154 (3.69%) giving combined total of 4169.
All London Posts

337a30c8-eeb1-408b-9f87-5ad21f046734|0|.0|27604f05-86ad-47ef-9e05-950bb762570c
For 2016 details - Barnet Property Market 2016
Story Highlights
- Barnet had total property sales of £3.366 Billions in 2015
- The total number of properties sold was 5607
- In 2015 the Average property price was £600 K while Median Price was £445 K
- Not New Property Contributed 85.02% and New Property 14.98% by Sales Value
Total Sales By Property Type
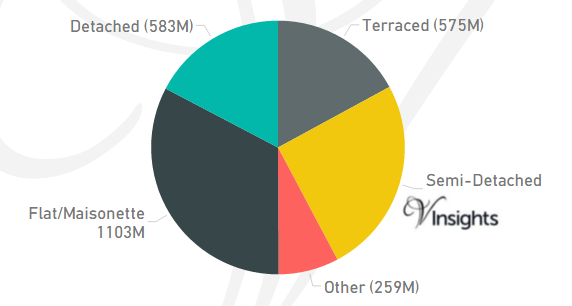
Barnet is one of the boroughs of North London. It had property sales of £3.366 Billions which was 48.22% of North London Property Market 2015 Property Market in 2015.
The split across the different property types are:
- Flat/Maisonette £1.103 billions (32.76%)
- Detached £583 millions (17.31%)
- Semi-Detached £847 millions (25.16%)
- Terraced £575 millions (17.08%)
- Other £259 millions (7.69%)
Total No Of Properties Sold By Property Type
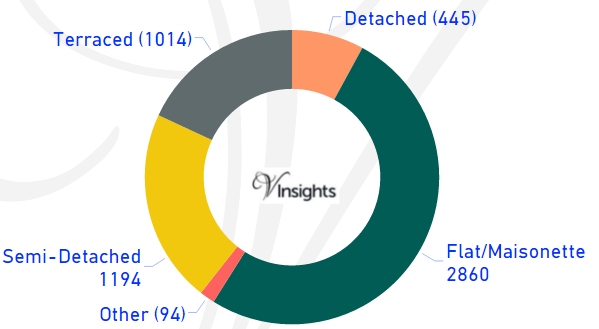
In Barnet the total number of properties sold in year 2015 was 5607. The breakdown by different property types are:
- Terraced 1014 (18.08%)
- Semi-Detached 1194 (21.29%)
- Other 94 (1.68%)
- Flat/Maisonette 2860 (51.01%)
- Detached 445 (7.94%)
Average & Median Sales Price
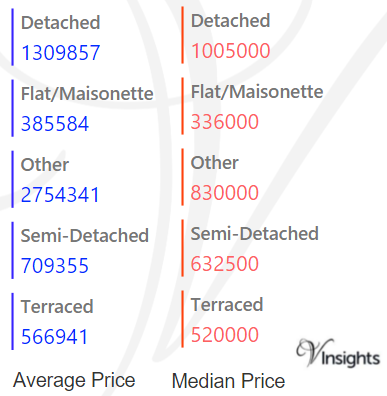
In 2015 the Average property price was £600 K in Barnet. The average price for the different property types was:
- Detached £1.31 millions
- Flat/Maisonette £386 K
- Other £2.75 millions
- Semi-Detached £709 K
- Terraced £567 K .
The Median Price in Barnet was £445 K. The median property price for the different property types was:
- Detached £1.0 million
- Flat/Maisonette £336 K
- Other £830 K
- Semi-Detached £633 K
- Terraced £520 K
New Vs Not New Property Statistics
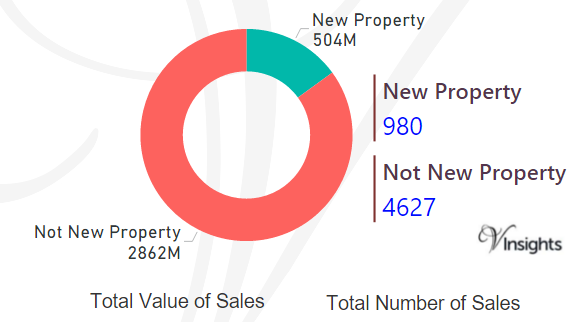
By Value Of Sales
- Not New Property contributed £2862 millions (85.02%)
- New Property 504 millions (14.98%) giving combined total of £3.366 Billions.
By Number Of Sales
- The number of Not New Property sold was 4627 (82.52%)
- The number of New Property sold was 980 (17.48%) giving combined total of 5607.
All London Posts
ab9a2fa0-fc04-4c60-be5c-d66a3e1917d6|0|.0|27604f05-86ad-47ef-9e05-950bb762570c

For 2016 details - North London Property Market 2016
Story Highlights
North London is the northern part of London. It comprises of Barnet, Enfield and Haringey
Total Sales By Property Type
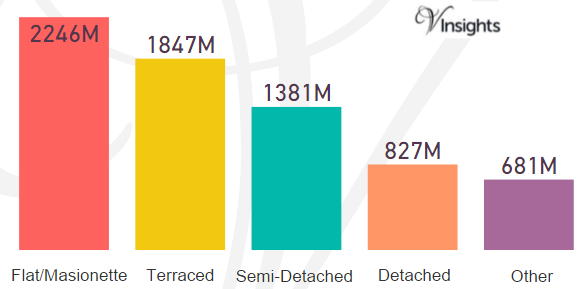
North London in 2015 had total property sales of £7 billions.The split across the different property types are:
- Detached: £827 millions (11.84%)
- Semi-Detached: £1.38 billions (19.78%)
- Terraced: £1.85 billions (26.45 %)
- Other: £681 million (9.75%)
- Flat/Maisonette: £2.25 billions (32.17%)
Total Sales By Borough
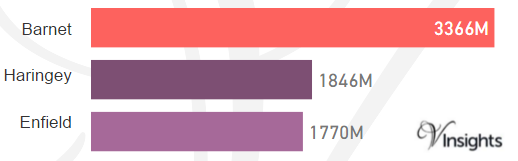
The total sales of £7 billions in 2015 was split across its borough as above.
Total Number Of Sales By Property Types
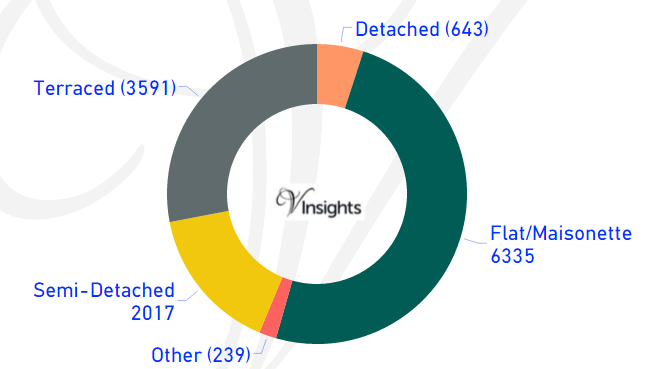
The total number of property sold in North London 2015 was 12,825. It is split as:
- Detached: 643 (5.01%)
- Semi-Detached: 2,017 (15.73%)
- Terraced: 3,591(28%)
- Flat/Maisonette: 6,335 (49.4%)
- Other: 239(15.73%)
Average & Median Sales Price
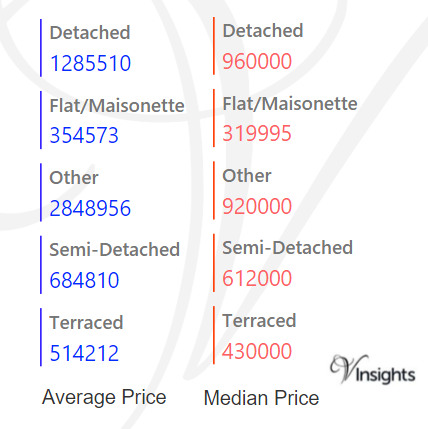
The average sales price in North London was £544 K. For the different property types it was:
- Detached: £1.286 millions
- Semi-Detached: £685 K
- Terraced: £514 K
- Flat/Maisonette: £355 K
- Other it is £2.85 millions.
Similarly the median sales price in North London was £395 K. For the different property types it was:
- Detached: £960 K
- Semi-Detached: £612 K
- Terraced: £430 K
- Flat/Maisonette: £320 K
- Other it is £920 K
Average & Median Sales Price By Borough
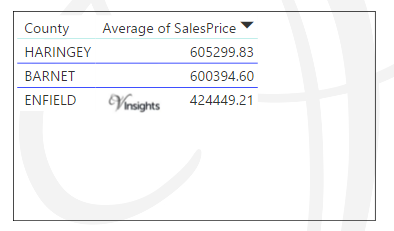
In North London the Average of Sales Price is as above.
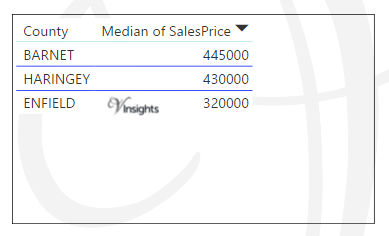
In North London the Median of Sales Price is as above.
New Vs Not New Property Statistics
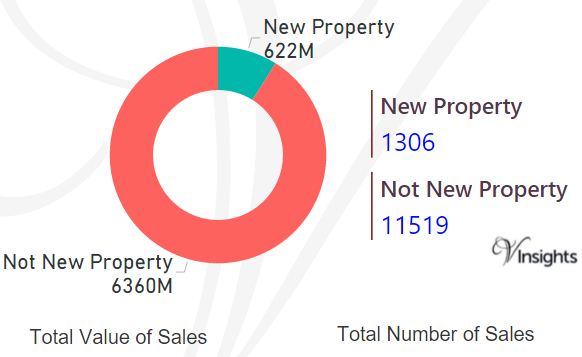
By Value Of Sales
- The sales value contributed by New Property was £622 millions (8.91%)
- Not New Property contributed £6.36 billions (91.09 %).
By Number Of Sales
- New properties sold were 1,306 (10.18%)
- Not new property sold were 11,519 (89.82%).
All London Posts
6552010f-a2c1-43ed-bf69-0bea9fc1fa49|1|5.0|27604f05-86ad-47ef-9e05-950bb762570c