Story Highlights
- Tower Hamlets had total Property Sales of £2.9 billions in 2016
- The total number of properties sold in year 2016 was 4821
- The Average property price was £601 K while Median was £460 K
- Not New Property contributed 65.63% by value and New Property 34.37%
- Stamp duty hike caused monthly spike in March
- Brexit and Stamp Duty hike did not have negative impact, there was growth of 11.5% by Total Sales Value
Tower Hamlets is one of the Boroughs of East London. It had total Property Sales of £2.9 billions which was 17.65% of East London Property Market 2016.
Total Sales By Property Type
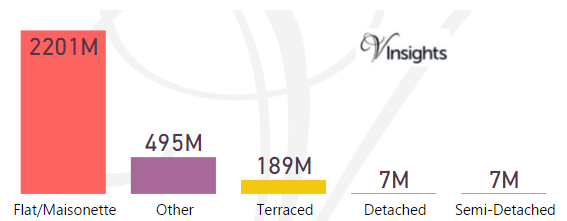
The split of £2.9 billions across the different property types are:
- Flat/Maisonette £2.2 billions (75.96%)
- Other £495 millions (17.08%)
- Terraced £189 millions (6.51%)
- Detached £7 millions
- Semi-Detached 7 millions
Year on Year Comparison : Compared to Tower Hamlets Property Market 2015 in 2016
- Flat/Maisonette ,Other have shown growth of 17.65%, 12% respectively
Tower Hamlets Property Market at Postcode Level
| Postcode |
Coverage Area
|
Local Authority Area |
| E1 |
Eastern head district: Aldgate (part), Bishopsgate (part), Whitechapel, Shoreditch (part), Spitalfields, Shadwell, Stepney, Globe Town (part), Mile End (part), Portsoken, Brick Lane
|
Tower Hamlets, Hackney, City of London |
| E1W |
Wapping
|
Tower Hamlets |
| E2 |
Bethnal Green district: Bethnal Green, Haggerston, Hoxton, Shoreditch (part), Cambridge Heath, Globe Town (part)
|
Tower Hamlets, Hackney |
| E3 |
Bow district: Bow, Bromley-by-Bow, Old Ford, Mile End, Fish Island, Bow Common, Poplar (part) Limehouse (part) Three Mills, London Gas Museum
|
Tower Hamlets, Newham |
| E9 |
Homerton district: Homerton, Hackney Wick, South Hackney, Hackney Marshes, Victoria Park
|
Hackney, Tower Hamlets |
| E14 |
Poplar district: Poplar, Isle of Dogs, Limehouse, Canary Wharf, Millwall, Blackwall, Cubitt Town, South Bromley, North Greenwich, Leamouth
|
Tower Hamlets |
For property market details at post code level please click on Postcode in the table above.
Month-wise Break-up of Total Sales
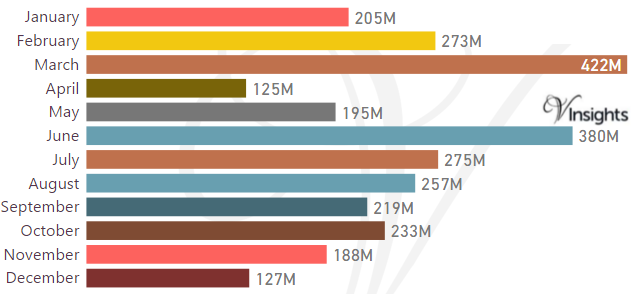
Stamp Duty Hike Impact
- March had property sale spike of £422 millions compared to £273 millions in Feb
- The impetus for it was to avoid the extra 3% in Stamp Duty Tax applicable on buying an additional home, being applicable from April 1 2016
Brexit Impact
- Brexit took place on 23rd June 2016.
- As can be observed from the month-wise break-up there does not seem to have been significant dip in property sales in the immediate aftermath of Brexit
- Year on Year the property market for Tower Hamles has shown growth of 11.54% over 2015
Total No Of Properties Sold By Property Type
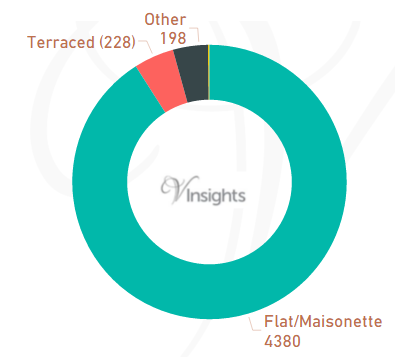
In Tower Hamlets the total number of properties sold in year 2016 was 4821. The breakdown by different property types are:
- Terraced 228 (4.73%)
- Other 198 (4.11%)
- Flat/Maisonette 4380 (90.85%)
- Semi-Detached 9 (0.19%).
Year on Year Comparison : Compared to Tower Hamlets Property Market 2015 in 2016
- Total number of property sales in Tower Hamlets has shown growth of 4.9%
- Other has shown significant increase of 50%.
Average & Median Sales Price
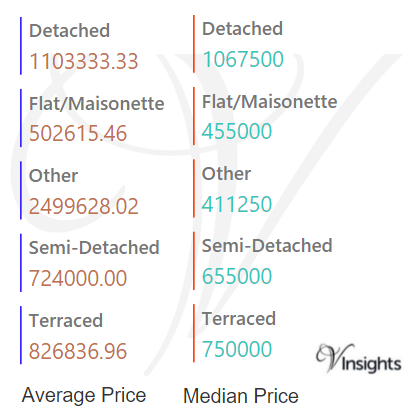
In 2016 the Average property price was £601 K in Tower Hamlets. The average price for the different property types are:
- Detached £1.1 millions
- Flat/Maisonette £503 K
- Other £2.5 millions
- Semi-Detached £724 K
- Terraced £827 K
The Median Price was £460 K. The median price for the different property types are:
- Detached £1.07 millions
- Flat/Maisonette £455 K
- Other £411 K
- Semi-Detached £655 K
- Terraced £750 K
Year on Year Comparison : Compared to Tower Hamlets Property Market 2015 in 2016
- The average and median sales price across all property types have gone up except for Other
- So property prices for business and commercial purpose has shown decline
New Vs Not New Property Statistics
By Value Of Sales
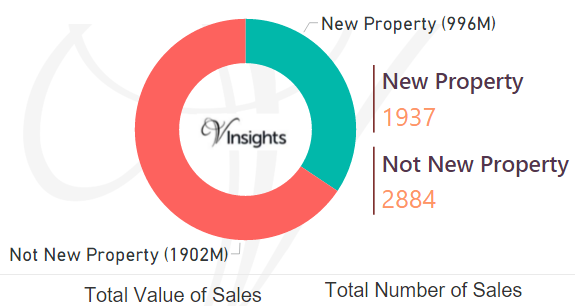
- Not New Property contributed £1.9 billion (65.63%)
- New Property £996 millions (34.37%)
By Number Of Sales
- The number of Not New Property sold was 2884 (59.82%)
- The number of New Properties sold was 1937 (40/18%)
Year on Year Comparison : Compared to Tower Hamlets Property Market 2015 in 2016
- New property market share in property market has gone up significantly in 2016 over 2015
All London Posts
5bcde5f8-f5d2-4290-8f83-d5a99454c4b6|0|.0|27604f05-86ad-47ef-9e05-950bb762570c
Story Highlights
- Newham had total Property Sales of £1.14 billions in 2016
- The total number of properties sold in year 2016 was 2741
- The Average property price was £416 K while Median was £348 K
- Not New Property Contributed 88.87% by value and New Property 11.13%
- Stamp duty hike caused monthly spike in March
- Brexit coupled with Stamp duty changes caused 5% decline in total sales value over 2015
Newham is one of the Boroughs of East London. It had total Property Sales of £1.14 billions which was 6.95% of East London Property Market 2016
Total Sales By Property Type
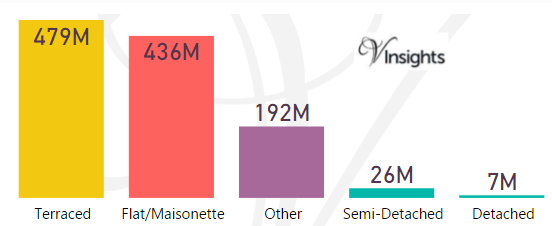
The split of £1.14 billions across the different property types are:
- Terraced £479 millions (42%)
- Flat/Maisonette £436 millions (38.26%)
- Other £192 millions (16.86%)
- Semi-Detached £26 millions (2.27%)
- Detached £7 millions (0.61%)
Year on Year Comparison : Compared to Newham Property Market 2015 in 2016
- All the property types have reamined constant or shown decline in sales value except Other
- Other has shown growth of 28.86%
Newham Property Market at Postcode level
| Postcode |
Coverage Area
|
Local Authority Area |
| E3 |
Bow district: Bow, Bromley-by-Bow, Old Ford, Mile End, Fish Island, Bow Common, Poplar (part) Limehouse (part) Three Mills, London Gas Museum
|
Tower Hamlets, Newham |
| E6 |
East Ham district: East Ham, Beckton, Upton Park (part), Barking (part) |
Newham, Barking and Dagenham |
| E7 |
Forest Gate district: Forest Gate, Leytonstone (Part), Stratford (part) |
Newham, Waltham Forest |
| E12 |
Manor Park district: Manor Park, Little Ilford, Aldersbrook (part) |
Newham, Redbridge,Barking and Dagenham |
| E13 |
Plaistow district: Plaistow, West Ham (part), Upton Park (part) |
Newham |
| E15 |
Stratford district: Stratford, West Ham (part), Maryland, Leyton (part), Leytonstone (part) Temple Mills (part), Hackney Wick (part), Bow (part) |
Newham, Waltham Forest, Hackney, Tower Hamlets |
| E16 |
Victoria Docks and North Woolwich district: Canning Town, Silvertown, Royal Docks, North Woolwich, Beckton (part)
|
Newham |
| E20 |
Olympic Park district: Olympic Park, & parts of Stratford, Homerton, Leyton, Bow
|
Newham, Waltham Forest, Hackney, Tower Hamlets |
For property market details at post code level please click on Postcode in the table above.
Month-wise Break-up of Total Sales
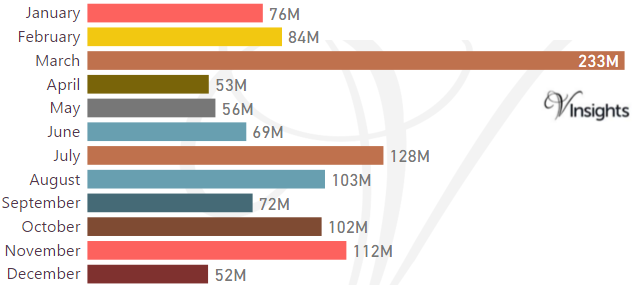
Stamp Duty Hike Impact
- March had property sale spike of £ 233 millions compared to £84 millions in Feb
- The impetus for it was to avoid the extra 3% in Stamp Duty Tax applicable on buying an additional home, being applicable from April 1 2016
Brexit Impact
- Brexit took place on 23rd June 2016.
- As can be observed from the month-wise break-up there does not seem to have been significant dip in property sales in the immediate aftermath of Brexit
- Year on Year the property market for Newham has declined by 5% over 2015
Total Number Of Sales By Property Types
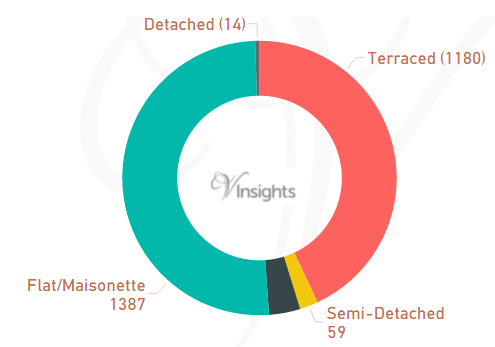
In Newham the total number of properties sold in year 2016 was 2741. The breakdown by different property types are:
- Terraced 1180 (43.05%)
- Semi-Detached 59 (2.15%)
- Other 101 (3.68%)
- Flat/Maisonette 1387 (50.6%)
- Detached 14 (0.51%)
Year on Year Comparison : Compared to Newham Property Market 2015 in 2016
- Total number of property sales in Newham has declined by 20.18%
- All property types have shown decline in number of properties sold except property type Other
- Other has shown significant growth of 77.2%.
Average & Median Sales Price
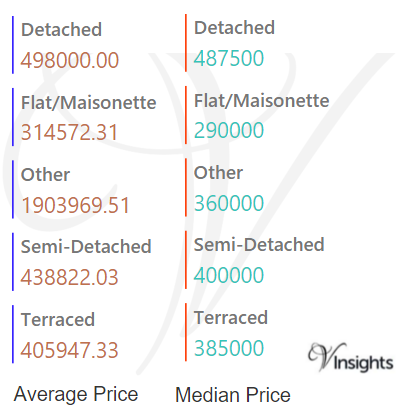
In 2015 the Average property price was £416 K in Newham. The average price for the different property types are:
- Detached £498 K
- Flat/Maisonette £315 K
- Other £1.9 millions
- Semi-Detached £439 K
- Terraced £406 K.
The Median Price was £348 K. The median property price for the different property types are:
- Detached £488 K
- Flat/Maisonette £290 K
- Other £360 K
- Semi-Detached £400 K
- Terraced £385 K
Year on Year Comparison : Compared to Newham Property Market 2015 in 2016
- The average and median sales price across all property types have gone up except for others
New Vs Not New Property Statistics
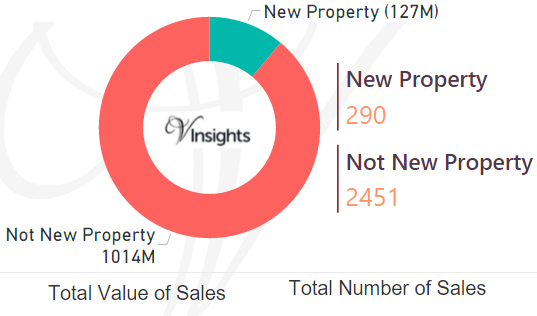
By Value Of Sales
- Not New Property contributed £1.01 billion (88.87%)
- New Property £127 millions (11.13%)
By Number Of Sales
- The number of Not New Property sold was 290 (10.58%)
- The number of New Properties sold was 2451 (89.42%)
Year on Year Comparison : Compared to Newham Property Market 2015 in 2016
- New property market share in property market has down in 2016 over 2015
All London Posts
a26e1289-cf88-498f-8eb8-ab89f397244e|0|.0|27604f05-86ad-47ef-9e05-950bb762570c
Story Highlights
- Redbridge had total Property Sales of £1.49 billions in 2016
- The total number of properties sold in year 2016 was 3260
- The Average property price was £458 K while Median was £385 K
- Not New Property contributed 97.03% by value and New Property 2.97%
- Stamp duty changes caused monthly spike in March
- Brexit and Stamp Duty changes did not have significant impact on Redbridge property market 2016
Redbridge is one of the Boroughs of East London. It had total Property Sales of £1.49 billions which was 9.09% of East London Property Market 2016.
Total Sales By Property Type
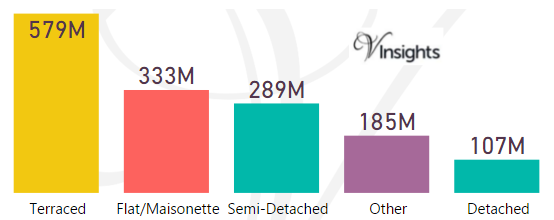
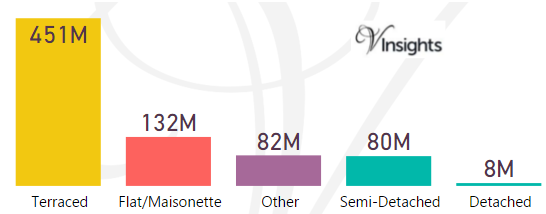
The split of £1.49 billions across the different property types are:
- Terraced £579 millions (38.8%)
- Flat/Maisonette £333 millions (22.72%)
- Semi-Detached £289 millions (19.36%)
- Other £185 millions (12.39%)
- Detached £107 millions (7.19%).
Year on Year Comparison : Compared to Redbridge Property Market 2015 in 2016
- All the property types have shown decline in sales except Flat/Maisonette, Other.
- Others has shown significant growth of about 172% year on year
Redbridge Property Market at Postcode Level
| Postcode |
Coverage Area
|
Local Authority Area |
| E11 |
Leytonstone district: Leytonstone, Wanstead, Aldersbrook (part), Snaresbrook, Cann Hall
|
Waltham Forest, Redbridge |
| E12 |
Manor Park district: Manor Park, Little Ilford, Aldersbrook (part) |
Newham, Redbridge,Barking and Dagenham |
| E18 |
Woodford and South Woodford district: Woodford, South Woodford |
Redbridge |
| IG1 |
Ilford, Cranbrook, Loxford |
Redbridge |
| IG2 |
Gants Hill, Newbury Park, Aldborough Hatch |
Redbridge |
| IG3 |
Seven Kings, Goodmayes |
Redbridge |
| IG4 |
Redbridge |
Redbridge |
| IG5 |
Clayhall |
Redbridge |
| IG6 |
Barkingside, Fullwell Cross, Hainault (south), Fairlop |
Redbridge |
| IG7 |
Chigwell, Chigwell Row, Hainault (north) |
Epping Forest, Redbridge |
| IG8 |
Woodford Green, Woodford Bridge, Highams Park (part) |
Redbridge, Waltham Forest |
| IG9 |
Buckhurst Hill |
Epping Forest, Redbridge |
| IG11 |
Barking, Creekmouth |
Barking and Dagenham, Redbridge |
| RM6 |
Chadwell Heath, Marks Gate, Little Heath, Goodmayes (north), Hainault (South)
|
Barking and Dagenham, Redbridge, Havering |
| RM8 |
Dagenham, Becontree, Becontree Heath, Chadwell Heath
|
Barking and Dagenham, Redbridge |
| RM9 |
Dagenham, Becontree Castle Green |
Barking and Dagenham, Redbridge, Havering |
For property market details at post code level please click on Postcode in the table above.
Month-wise Break-up of Total Sales
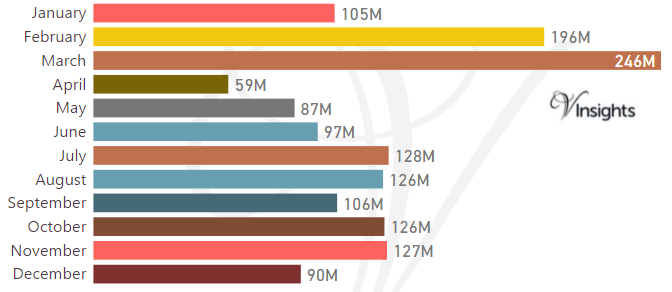
Stamp Duty Hike Impact
- March had property sale spike of £246 millions compared to £ 196 millions in Feb
- The impetus for it was to avoid the extra 3% in Stamp Duty Tax applicable on buying an additional home, being applicable from April 1 2016
Brexit Impact
- Brexit took place on 23rd June 2016.
- As can be observed from the month-wise break-up there does not seem to have been dip in property sales in the immediate aftermath of Brexit
- Year on Year the property market for Redbridge has shown growth of 3.5% over 2015
Total No Of Properties Sold By Property Type
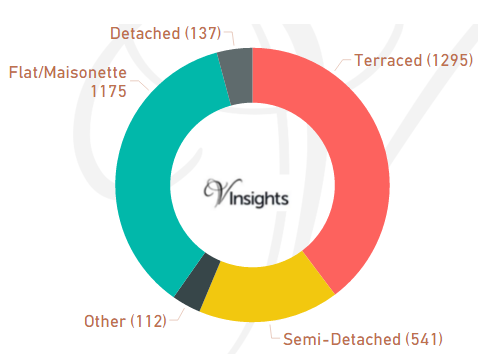
In Redbridge the total number of properties sold in year 2016 was 3260. The breakdown by different property types are:
- Terraced 1295 (39.72%)
- Semi-Detached 541 (16.6%)
- Other 112 (3.44%)
- Flat/Maisonette 1175 (36.04%)
- Detached 137 (4.2%).
Year on Year Comparison : Compared to Redbridge Property Market 2015 in 2016
- Total number of property sales in Redbrdige has declined by 11.03%
- All property types have shown decline in number of properties sold except Other
- Other has shown significant increase of 111%.
Average & Median Sales Price
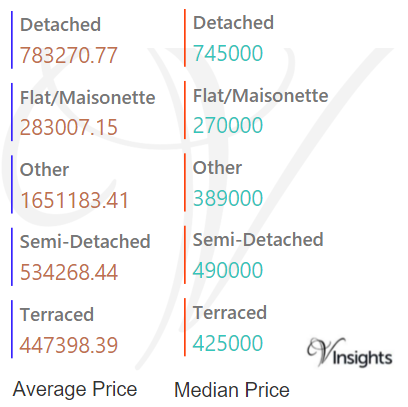
In 2016 the Average property price was £458 K in Redbridge. The average price for the different property types are:
- Detached £783 K
- Flat/Maisonette £283 K
- Other £1.65 millions
- Semi-Detached £534 K
- Terraced £447 K.
The Median Price was £385 K. The median property price for the different property types are:
- Detached £745 K
- Flat/Maisonette £270 K
- Other £389 K
- Semi-Detached £490 K
- Terraced £425 K.
Year on Year Comparison : Compared to Redbridge Property Market 2015 in 2016
- The average and median sales price across all property types have gone up except for Other
- Other decline indicates that property for business/commercial purpose became cheaper in 2016 compared to 2015
New Vs Not New Property Statistics
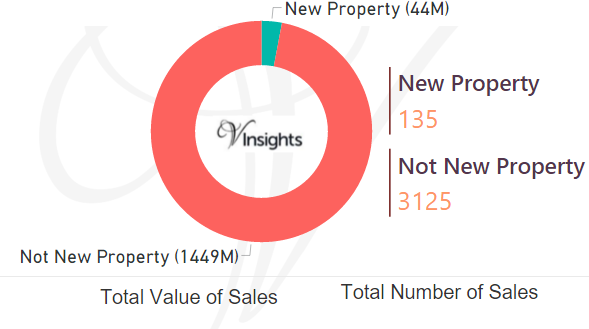
By Value Of Sales
- Not New Property contributed £1.5 billion (97.03%)
- New Property £44 millions (2.97%)
By Number Of Sales
- The number of Not New Property sold was 3125 (95.86%)
- The number of New Properties sold was 135 (4.14%)
Year on Year Comparison : Compared to Redbridge Property Market 2015 in 2016
- New property market share in property market has gone down in 2016 over 2015
All London Posts
128f45f1-1785-4c37-a326-a781448427f6|0|.0|27604f05-86ad-47ef-9e05-950bb762570c
Story Highlights
- Barking and Dagenham in 2016 had total property sales of £753 millions.
- The total number of properties sold in year 2016 was 2390
- The Average property price was £315 K while median was £287 K
- Not New Property Contributed 92.12% and New Property 7.88% by sales value
- Stamp duty changes caused monthly spike in March
- Brexit coupled with Stamp duty changes has not impacted the property market, total sales has shown growth of 4.7%
Barking and Dagenham is one of the boroughs of East London.
Total Sales By Property Type
Barking And Dagenham is one of the boroughs of East London. It had property sales of £753 millions which was 4.59% of East London Property Market in 2016.
The breakdown of £753 millions by different property in Barking And Dagenham was:
- Terraced £451 millions (59.94%)
- Detached £7.6 millions (1%)
- Flat/Maisonette £132 millions (17.5%)
- Other £82 millions (10.92%)
- Semi-Detached £80 millions (10.64%).
Year on Year Comparison : Compared to Barking And Dagenham Property Market 2015 in 2016
- Barking And Dagenham as a whole had property sales by value increase of 4.72 %
- Only property type Other has shown decline i.e. 21.2 %
Barking And Dagenham Property Market at Postcode Level
| Postcode |
Coverage Area
|
Local Authority Area |
| E12 |
Manor Park district: Manor Park, Little Ilford, Aldersbrook (part) |
Newham, Redbridge, Barking and Dagenham |
| IG11 |
Barking, Creekmouth |
Barking and Dagenham |
| RM6 |
Chadwell Heath, Marks Gate, Little Heath, Goodmayes (north), Hainault (South) |
Barking and Dagenham, Redbridge, Havering |
| RM7 |
Rush Green, Mawneys, Romford |
Havering, Barking and Dagenham |
| RM8 |
Dagenham, Becontree, Becontree Heath, Chadwell Heath |
Barking and Dagenham, Redbridge |
| RM9 |
Dagenham, Becontree Castle Green |
Barking and Dagenham, Redbridge, Havering |
| RM10 |
Dagenham, Becontree |
Barking and Dagenham |
For property market details at post code level please click on Postcode in the table above.
Month-wise Break-up of Total Sales
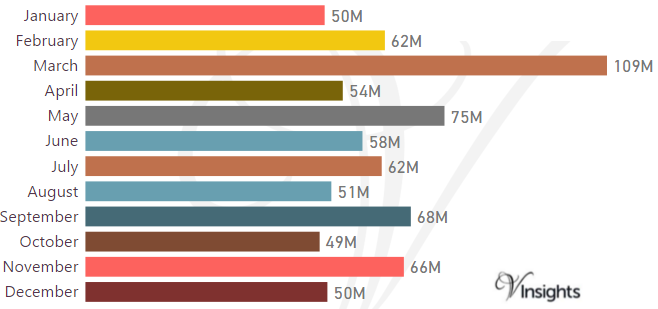
Stamp Duty Hike Impact
- March had property sale spike of £109 millions compared to £62 millions in Feb
- The impetus for it was to avoid the extra 3% in Stamp Duty Tax applicable on buying an additional home, being applicable from April 1 2016
Brexit Impact
- Brexit took place on 23rd June 2016.
- As can be observed from the month-wise break-up there does not seem to have been any dip in property sales in the immediate aftermath of Brexit
- Year on Year the property market by sales value has shown growth of 4.72%
Total No Of Properties Sold By Property Type
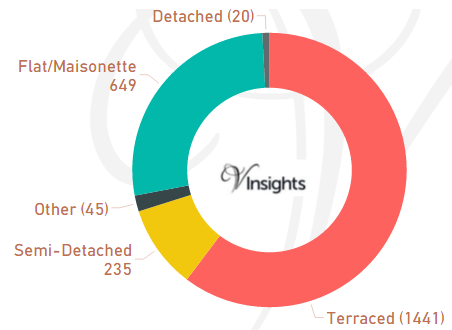
In Barking And Dagenham the total number of properties sold in year 2016 was 2390.
The breakdown by different property types are:
- Terraced 1441(60.29%)
- Semi-Detached 235(9.83%)
- Other 45(1.88%)
- Flat/Maisonette 649(27.15%)
- Detached 20(0.84%)
Year on Year Comparison : Compared to Barking And Dagenham Property Market 2015 in 2016
- Total number of property sales in Barking and Dagenham has declined by 8.2%
- Except Semi-Detached all property types have shown decrease in total number of properties sold year on year.
- Semi-Detached has shown growth of 3.5%
Average & Median Sales Price
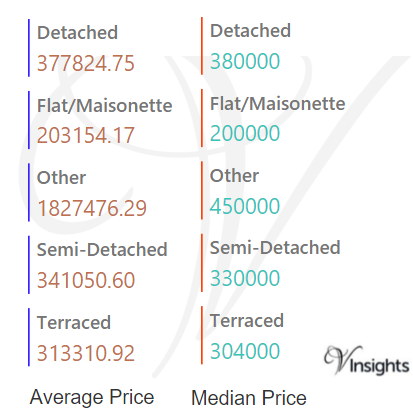
In 2016 the Average property price was £315 K in Barking and Dagenham.
The average property price for the different property types are:
- Detached £378 K
- Flat/Maisonette £203 K
- Other £1.83 millions
- Semi-Detached £341 K
- Terraced £313 K
The Median Price in Barking and Dagenham was £287 K.
The median property price for the different property types are:
- Detached £380 K
- Flat/Maisonette £200 K
- Other £450 K
- Semi-Detached £330 K
- Terraced £304 K
Year on Year Comparison : Compared to Barking And Dagenham Property Market 2015
- The average and median sales price across all property types have gone up except for others
New Vs Not New Property Statistics
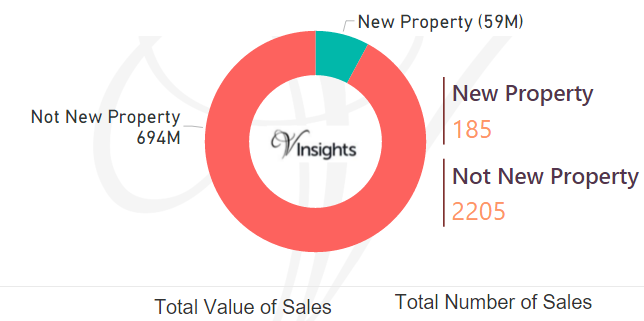
By Value Of Sales
- Not New Property contributed £694 millions (92.12%)
- New Property £59 millions (7.88%)
By Number Of Sales
- Not New Property sold was 2205 (92.26%)
- New Properties sold were 185 (7.74%)
Year on Year Comparison : Compared to Barking And Dagenham Property Market 2015 in 2016
- New property market share by Sales Values in property market has not shown appreciable change
All London Posts
f4ac1aff-b3be-4d0e-bb2a-6f38773a5e2f|0|.0|27604f05-86ad-47ef-9e05-950bb762570c
Story Highlights
- Lewisham had total Property Sales of £2 billions in 2016
- The total number of properties sold in year 2016 was 4364
- The Average property price was £460 K in Lewisham while Median was £383 K
- Not New Property Contributed 86.6% by value and New Property 13.4%
- Stamp duty hike caused monthly spike in March
- Brexit coupled with Stamp duty hike caused decline in total property sales by 12.51% in 2016
Lewisham is one of the Boroughs of East London. It had total Property Sales of £2 billions which was 12.23% of East London Property Market 2016
Total Sales By Property Type
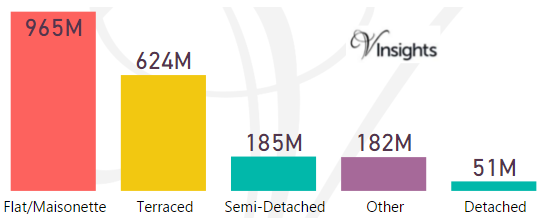
The total sales of £2 billions, split across the different property types are:
- Flat/Maisonette £965 millions (48.09%)
- Terraced £624 millions (31.08%)
- Semi-Detached £185 millions (9.21%)
- Other £182 millions (9.06%)
- Detached £51 millions (2.55%).
Year on Year Comparison : Compared to Lewisham Property Market 2015 in 2016
- All the property types have shown decline in sales except Flat/Maiosnette
- Flat/Maiosnette property sales has remained fairly constant
Lewisham Property Market at Postcode Level
| Postcode |
Coverage Area
|
Local Authority Area |
| BR1 |
Bromley, Bickley, Downham, Sundridge
|
Bromley, Lewisham |
| BR3 |
Beckenham, Elmers End, Shortlands, Eden Park, Park Langley
|
Bromley, Lewisham, Croydon |
| SE3 |
Blackheath, Kidbrooke, Westcombe Park
|
Greenwich, Lewisham |
| SE4 |
Brockley, Crofton Park
|
Lewisham, Southwark |
| SE6 |
Catford, Bellingham, Hither Green (part)
|
Lewisham |
| SE8 |
Deptford, Evelyn, Rotherhithe
|
Greenwich, Lewisham, Southwark |
| SE9 |
Eltham, Mottingham, New Eltham, Avery Hill (part), Falconwood (part), Sidcup (part), Chinbrook (part), Longlands (part) Kidbrooke (part), Shooter's Hill (part)
|
Bexley,Bromley, Greenwich, Lewisham
|
| SE10 |
Greenwich, Maze Hill, Greenwich Peninsula
|
Greenwich, Lewisham |
| SE12 |
Lee, Grove Park, Chinbrook, Hither Green (part), Eltham (part), Horn Park, Blackheath (part)
|
Greenwich, Lewisham |
| SE13 |
Lewisham, Hither Green, Ladywell
|
Greenwich, Lewisham |
| SE14 |
New Cross
|
Lewisham, Southwark |
| SE15 |
Peckham, Nunhead, South Bermondsey (part), Old Kent Road (part)
|
Lewisham, Southwark |
| SE16 |
Rotherhithe, Surrey Quays
|
Southwark, Lewisham |
| SE22 |
East Dulwich, Dulwich Village (part), Peckham Rye, Loughborough Junction, Herne Hill
|
Southwark, Lewisham |
| SE23 |
Forest Hill, Honor Oak, Crofton Park (part)
|
Lewisham, Southwark |
| SE26 |
Sydenham, Crystal Palace (part)
|
Bromley, Lewisham, Southwark, Bexley |
For property market details at post code level please click on Postcode in the table above.
Month-wise Break-up of Total Sales
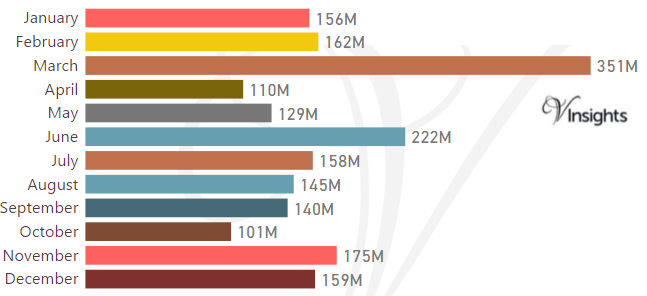
Stamp Duty Hike Impact
- March had property sale spike of £351 millions compared to £162 millions in Feb
- The impetus for it was to avoid the extra 3% in Stamp Duty Tax applicable on buying an additional home, being applicable from April 1 2016
Brexit Impact
- Brexit took place on 23rd June 2016.
- As can be observed from the month-wise break-up there does not seem to have been significant dip in property sales in the immediate aftermath of Brexit
- Year on Year the property market for Lewisham has shown decline of 12.51% over 2015
Total No Of Properties Sold By Property Type
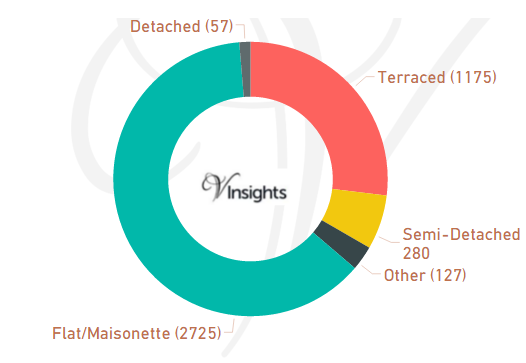
In Lewisham the total number of properties sold in year 2016 was 4364. The breakdown by different property types are:
- Terraced 1175 (26.92%)
- Semi-Detached 280 (6.42%)
- Other 127 (2.91%)
- Flat/Maisonette 2725 (62.44%)
- Detached 57 (1.31%).
Year on Year Comparison : Compared to Lewisham Property Market 2015 in 2016
- Total number of property sales in Lewisham has declined by 12.8 %
- All property types have shown decline in number of properties sold except property type Other
- Other has shown significant growth of 49.4% by number of sales
Average & Median Sales Price
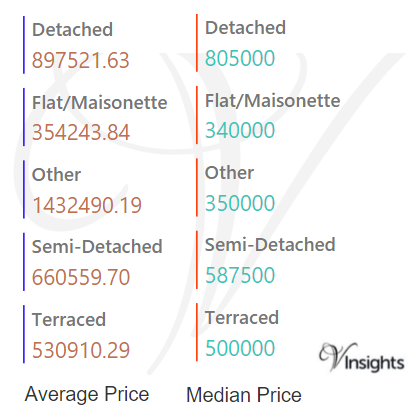
In 2016 the Average property price was £460 K in Lewisham. The average price for the different property types are:
- Detached £898 K
- Flat/Maisonette £354 K
- Other £1.43 millions
- Semi-Detached £661 K
- Terraced £531 K.
The Median Price was £383 K. The median property price for the different property types are:
- Detached £805 K
- Flat/Maisonette £340 K
- Other £350 K
- Semi-Detached £588 K
- Terraced £500 K
Year on Year Comparison : Compared to Lewisham Property Market 2015 in 2016
- The average and median sales price across all property types have gone up except for others
New Vs Not New Property Statistics
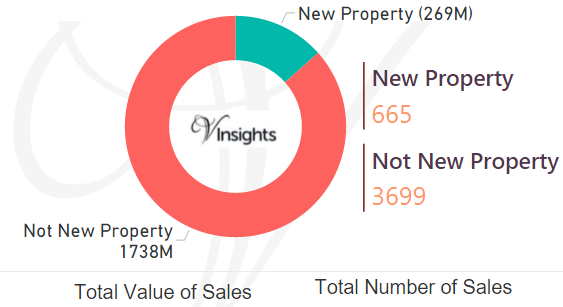
By Value Of Sales
- Not New Property contributed £1.74 billions (86.6%)
- New Property £269 millions (13.4%)
By Number Of Sales
- The number of Not New Property sold was 3699 (84.76%)
- The number of New Properties sold was 665 (15.24%)
Year on Year Comparison : Compared to Lewisham Property Market 2015 in 2016
- New property market share in property market has gone up in 2016 over 2015
All London Posts
97033717-294f-47d4-acaf-465871925e14|0|.0|27604f05-86ad-47ef-9e05-950bb762570c