Story Highlights
- Haringey had total Property Sales of £1.68 billions in 2016
- The total number of properties sold in year 2016 was 2761.
- The Average property price was £607 K in Haringey, while Median was was £446 K.
- Not New Property Contributed 93.35% and New Property 6.65% by sales value.
- Stamp duty hike caused monthly spike in March.
- Brexit coupled with Stamp duty hike caused total sales to decline by 9% in 2016.
Haringey is one of the Boroughs of North London. It had total Property Sales of £1.68 billions which was 25.38% of North London Property Market 2016.
Total Sales By Property Type
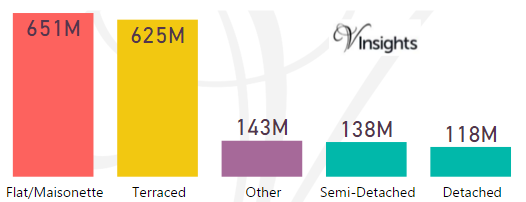
The split of £1.68 billions across the different property types are:
- Flat/Maisonette £651 millions (38.87%)
- Terraced £625 millions (37.29%)
- Other £143 millions (8.54%)
- Semi-Detached £138 millions (8.23%)
- Detached £118 millions (7.07%)
Year on Year Comparison : Compared to Haringey Property Market 2015 in 2016
- Haringey as a whole had property sales decrease of 9.2%
- All property types had decrease in total property sales compared to 2015
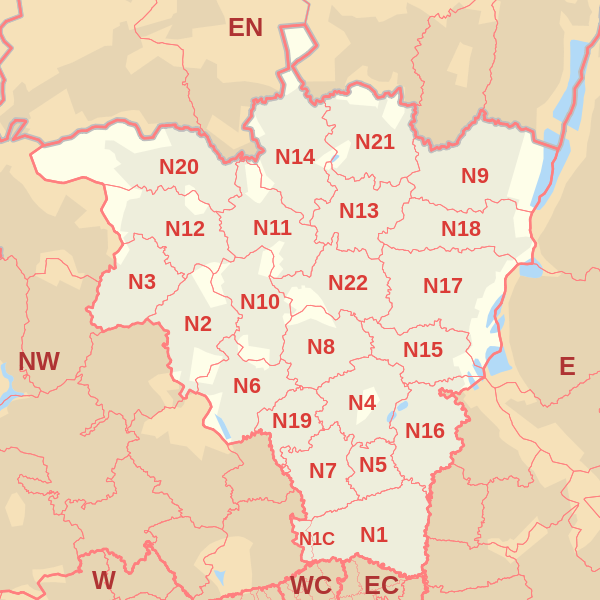
Haringey Property Market at Postcode level
 |
| Postcode |
Coverage Area
|
Local Authority Area |
| N2 |
East Finchley, Fortis Green, Hampstead Garden Suburb (part)
|
Barnet, Haringey |
| N4 |
Finsbury Park, Manor House, Harringay (part), Stroud Green (part)
|
Haringey, Islington, Hackney |
| N6 |
Highgate, Hampstead Heath (part)
|
Camden, Haringey, Islington |
| N8 |
Hornsey, Crouch End, Harringay (part)
|
Haringey, Islington |
| N10 |
Muswell Hill
|
Haringey, Barnet |
| N11 |
New Southgate, Friern Barnet, Bounds Green, Arnos Grove (part)
|
Enfield, Barnet, Haringey |
| N13 |
Palmers Green |
Enfield, Haringey |
| N15 |
South Tottenham, Harringay (part), West Green, Seven Sisters, Stamford Hill (part)
|
Hackney, Haringey |
| N17 |
Tottenham, Wood Green (part)
|
Haringey |
| N18 |
Upper Edmonton, Edmonton (part)
|
Enfield, Haringey |
| N22 |
Wood Green, Bounds Green (part), Bowes Park
|
Haringey, Enfield |
For property market details at post code level please click on Postcode in the table above.
Month-wise Break-up of Total Sales
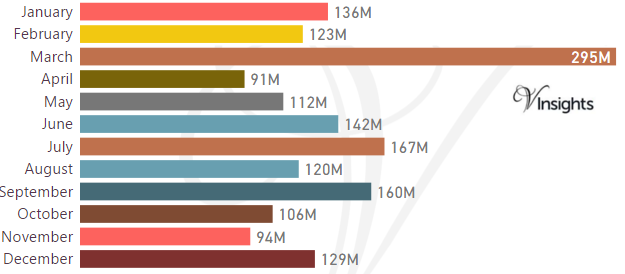
Stamp Duty Hike Impact
- March had property sale spike of £295 millions compared to £123 millions in Feb
- The impetus for it was to avoid the extra 3% in Stamp Duty Tax applicable on buying an additional home, being applicable from April 1 2016
Brexit Impact
- Brexit took place on 23rd June 2016.
- As can be observed from the month-wise break-up there does seem to have been some dip in property sales in the immediate aftermath of Brexit
- Year on Year property market for Haringey has shown a decline of 9.2% over 2015
Total No Of Properties Sold By Property Type
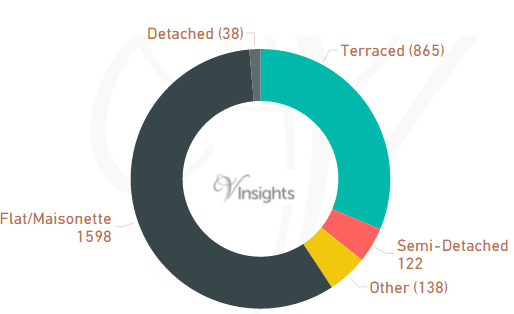
In Haringey the total number of properties sold in year 2016 was 2761. The breakdown by different property types are:
- Terraced 865 (31.33%)
- Semi-Detached 122 (4.42%)
- Other 138 (5%)
- Flat/Maisonette 1598 (57.88%)
- Detached 38 (1.38%)
Year on Year Comparison : Compared to Haringey Property Market 2015 in 2016
- Total number of property sales in Haringey has declined by 9.4%
- All property types have shown decline in number of properties sold except property type Other
- Other has shown significant growth of 70.4%
Average & Median Sales Price
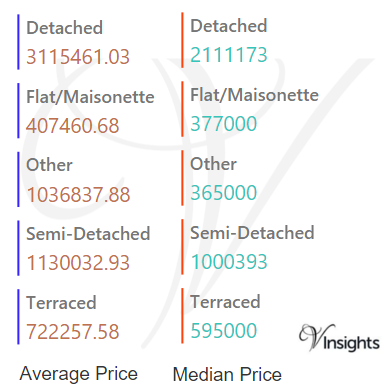
In 2016 the Average property price was £607 K in Haringey. The average price for the different property types are:
- Detached £3.12 millions
- Flat/Maisonette £408 K
- Other £1.04 millions
- Semi-Detached £1.13 millions
- Terraced £722 K
The Median Price was £446 K. The median property price for the different property types are:
- Detached £2.1 millions
- Flat/Maisonette £377 K
- Other £365 K
- Semi-Detached £1 millions
- Terraced £595 K
Year on Year Comparison : Compared to Haringey Property Market 2015
- The average and median sales price across all property types have gone up except for others
- Others have shown sharp decline in average and median sales price
New Vs Not New Property Statistics
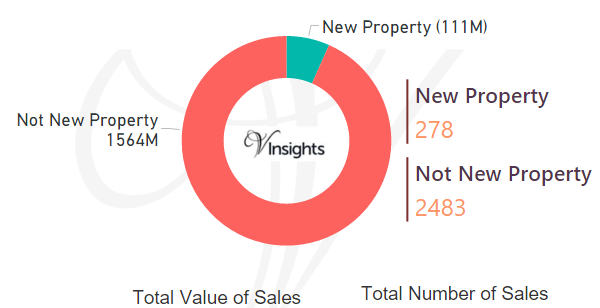
By Value Of Sales
- Not New Property contributed £1.56 billion (93.35%)
- New Property £111 millions (6.65%)
By Number Of Sales
- The number of Not New Property sold was 2483 (89.93%)
- The number of New Property sold was 278 (10.07%)
Year on Year Comparison : Compared to Haringey Property Market 2015 in 2016
- New property market share in property market has gone up in 2016 over 2015
All London Posts
e761c576-2ee1-4a18-bda7-05a9a5aefb6e|0|.0|27604f05-86ad-47ef-9e05-950bb762570c