Story Highlights
- Enfield had total Property Sales of £1.67 billions in 2016
- The total number of properties sold in year 2016 was 3611
- The Average property price was £464 K in Enfield, while Median was £375 K
- Not New Property contributed 95.93% and New Property 4.07% by sales value
- Stamp duty hike caused monthly spike in March
- Brexit coupled with Stamp duty hike caused decline in total sales value of 5.6%
Enfiled is one of the Boroughs of North London. It had total Property Sales of £1.67 billions which was 25.36 % of North London Property Market 2016.
Total Sales By Property Type
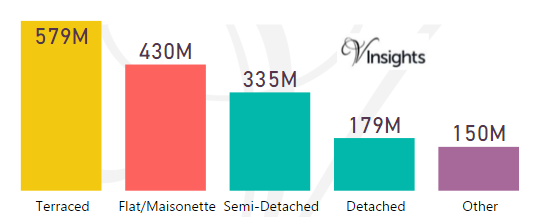
The split of £1.67 billions across the different property types are:
- Terraced £579 millions (34.6%)
- Flat/Maisonette £430 millions (25.71%)
- Semi-Detached £335 millions (20.03%)
- Detached £179 millions (10.72%)
- Other £150 millions (8.93%)
Year on Year Comparison : Compared to Enfield Property Market 2015 in 2016
- All the property types have shown decline in sales except Terraced
- Terraced properties have shown negligible growth of 0.34%
Enfield Property Market at Postcode level
| Postcode |
Coverage Area
|
Local Authority Area |
| EN1 |
Bush Hill Park; eastern parts of Bulls Cross, Enfield Town, Forty Hill, outskirts of Lower Edmonton
|
Enfield |
| EN2 |
Botany Bay, Clay Hill, Crews Hill; western parts of Bulls Cross, Enfield Chase, Enfield Town, Forty Hill, Gordon Hill
|
Enfield |
| EN3 |
Enfield Highway, Enfield Island Village, Enfield Lock, Enfield Wash, Ponders End
|
Enfield |
| EN4 |
Hadley Wood, Cockfosters, East Barnet, New Barnet
|
Barnet, Enfield |
| EN7 |
Cheshunt, Goffs Oak, Some parts of Enfield
|
Broxbourne, Enfield |
| EN8 |
Waltham Cross, Cheshunt, Some parts of Enfield
|
Broxbourne, Enfield |
| N9 |
Lower Edmonton, Edmonton (part)
|
Enfield |
| N11 |
New Southgate, Friern Barnet, Bounds Green, Arnos Grove (part)
|
Enfield, Barnet, Haringey |
| N13 |
Palmers Green
|
Enfield |
| N14 |
Southgate, Oakwood, Arnos Grove (part)
|
Enfield, Barnet |
| N18 |
Upper Edmonton, Edmonton (part)
|
Enfield |
| N21 |
Winchmore Hill, Bush Hill, Grange Park
|
Enfield |
| N22 |
Wood Green, Bounds Green (part), Bowes Park
|
Haringey, Enfield |
For property market details at post code level please click on Postcode in the table above.
Month-wise Break-up of Total Sales
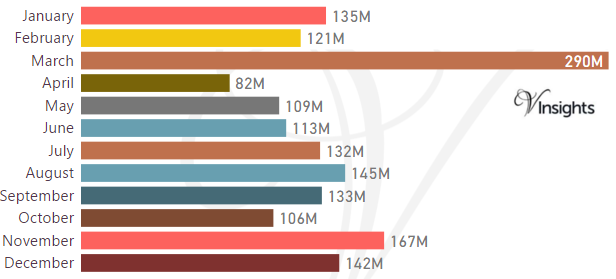
Stamp Duty Hike Impact
- March had property sale spike of £290 millions compared to £121 millions in Feb
- The impetus for it was to avoid the extra 3% in Stamp Duty Tax applicable on buying an additional home, being applicable from April 1 2016
Brexit Impact
- Brexit took place on 23rd June 2016.
- As can be observed from the month-wise break-up there does not seem to have been dip in property sales in the immediate aftermath of Brexit
- Year on Year the property market for Enfield has shown a decline of 5.65% over 2015
Total No Of Properties Sold By Property Type
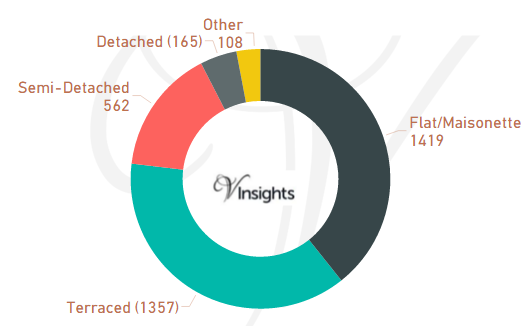
In Enfield the total number of properties sold in year 2016 was 3611. The breakdown by different property types are:
- Terraced 1357 (37.58%)
- Semi-Detached 562 (15.56%)
- Other 108 (2.99%)
- Flat/Maisonette 1419 (39.3%)
- Detached 165 (4.57%)
Year on Year Comparison : Compared to Enfield Property Market 2015 in 2016
- Total number of property sales in Enfield has declined by 13.38%
- All property types have shown decline in number of properties sold except property type Other, Detached
- Other has shown significant increase of 68.75%
Average & Median Sales Price
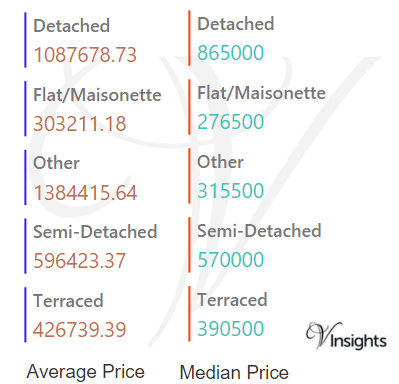
In 2016 the Average property price was £464 K in Enfield. The average price for the different property types are:
- Detached £1.1 millions
- Flat/Maisonette £303 K
- Other £1.38 millions
- Semi-Detached £596 K
- Terraced £427 K
The Median Price was £375 K. The median property price for the different property types are:
- Detached £865 K
- Flat/Maisonette £277 K
- Other £316 K
- Semi-Detached £570 K
- Terraced £391 K
Year on Year Comparison : Compared to Enfield Property Market 2015
- The average and median sales price across all property types have gone up except for others
- Other have shown sharp decline in average and median sales price
New Vs Not New Property Statistics
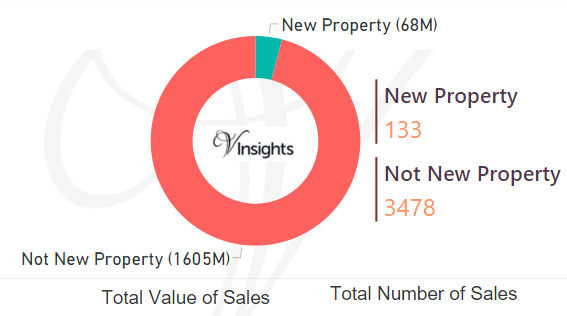
By Value Of Sales
- Not New Property contributed £1.61 billion (95.93%)
- New Property £68 millions (4.07%)
By Number Of Sales
- The number of Not New Property sold was 3478 (96.32%)
- The number of New Property sold was 133 (3.68%)
Year on Year Comparison : Compared to Enfield Property Market 2015 in 2016
- New property market share in property market has gone up in 2016 over 2015
All London Posts
dc8593ff-bfc9-4c3c-ae58-278dd7b37cf5|0|.0|27604f05-86ad-47ef-9e05-950bb762570c