Story Highlights
- Tandridge had total property sales of £760 millions in 2016
- The total number of properties sold in 2016 was 1,702
- The average sales price was £446 K, whereas the median was £385 K
- New Property sales were 8.57% by value, whereas Not New Property contributed 91.43%
- Stamp duty changes caused monthly spike in March
- Brexit coupled with Stamp Duty changes had negative impact, declines by 11.8% over 2015
Tandridge is one of the districts of Surrey.
Total Sales By Property Type
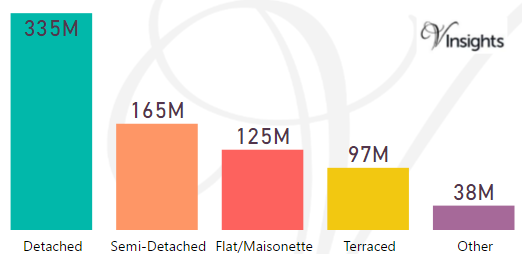
Tandridge had total property sales of £760 millions which was 7.08% of the total Surrey Property Market 2016
The split of £760 millions across the different property types are:
- Detached £335 millions (44.15%)
- Semi-Detached £165 millions (21.68%)
- Flat/Maisonette £125 millions (16.4%)
- Terraced £97 millions (12.72%)
- Other £38 millions (5.04%)
Tandridge Property Market at Postcode Level
| Postcode |
Coverage Area |
School |
Local Authority Area |
| CR3 |
Caterham, Chaldon, Woldingham, Whyteleafe, Hamsey Green |
Details |
Tandridge, Croydon |
| CR6 |
Warlingham, parts of Chelsham and Farleigh, Hamsey Green |
Details |
Tandridge, Croydon, Bromley |
| CR8 |
Purley, Kenley, Russell Hill |
Details |
Croydon, Sutton, Tandridge |
| RH1 |
Redhill, Merstham, Earlswood, South Earlswood, Whitebushes, Salfords,Nutfield Marsh,
South Nutfield, Bletchingley, Outwood |
Details |
Reigate and Banstead, Tandridge |
| RH6 |
Gatwick Airport,Horley, Burstow |
Details |
Reigate and Banstead, Crawley, Mole Valley, Tandridge |
| RH7 |
Lingfield, Dormansland, Crowhurst |
Details |
Tandridge |
| RH8 |
Oxted, Limpsfield, Limpsfield Chart, Hurst Green, Merle Common, Tandridge, Crowhurst Lane End |
Details |
Tandridge |
| RH9 |
Godstone, South Godstone |
Details |
Tandridge |
| RH19 |
East Grinstead, Ashurst Wood, Dormans Park, Felbridge, Felcourt, Sharpthorne, West Hoathly |
Details |
Mid Sussex, Tandridge |
| TN8 |
Crockham Hill, Edenbridge |
Details |
Sevenoaks, Tandridge |
| TN16 |
Westerham, Biggin Hill, Tatsfield |
Details |
Sevenoaks, Bromley, Tandridge |
Month-wise Break-up of Total Sales
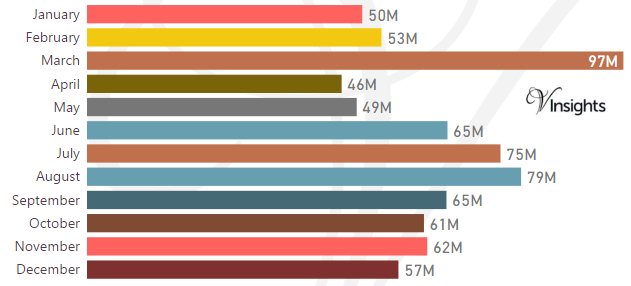
Some of the insights based on the £760 millions month-wise break-down :
Stamp Duty Hike Impact
- March had property sale spike of £97 millions compared to £53 millions in Feb and then sales sharply drop
- The impetus for it was to avoid the extra 3% in Stamp Duty Tax applicable on buying an additional home, being applicable from April 1 2016
Brexit Impact
- Brexit took place on 23rd June 2016.
- Year on Year decrease has been 11.8% in 2016 over 2015
- Brexit coupled with Stamp Duty Hike had negative impact on Tandridge Property Market in 2016
Total No Of Properties Sold By Property Type
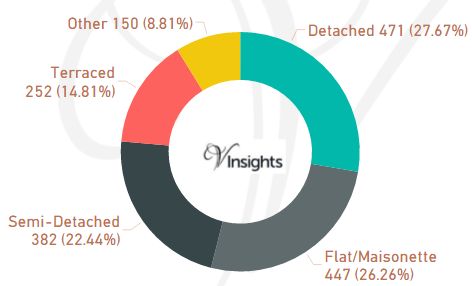
Tandridge had total property sales of 1,702. The split across the different property types are:
- Detached 471 (27.67%)
- Flat/Maisonette 447 (26.26%)
- Semi-Detached 382 (22.44%)
- Terraced 252 (14.81%)
- Other 150 (8.81%)
Average & Median Sales Price
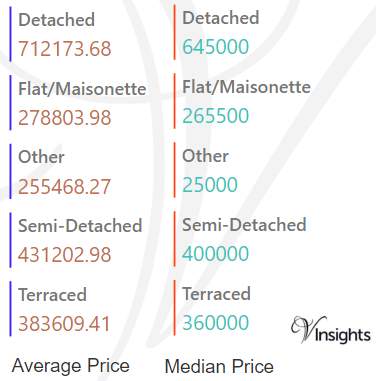
The average sales price in Tandridge was £446 K and for different property types it was:
- Detached £712 K
- Semi-Detached £431 K
- Terraced £384 K
- Flat/Maisonette £279 K
- Other it is £ 255 K
Similarly median sales price in Tandridge was £385 K and for different property types are:
- Detached £645 K
- Semi-Detached £400 K
- Terraced £360 K
- Flat/Maisonette £266 K
- Other it is £250 K
New Vs Not New Property Statistics
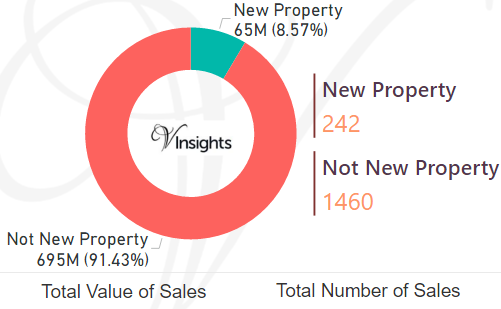
By Sales Value the split is as follows:
- New Property contributed £65 millions (8.57%)
- Not New Property contributed £695 millions (91.43%)
By Total Number the split is as follows:
- New properties sold were 242 (14.22%)
- Not new property sold were 1,460 (85.78%)
All Surrey Posts

13d09c0c-a7ac-4282-9d7a-8b8a93f8b1f9|0|.0|27604f05-86ad-47ef-9e05-950bb762570c