Story Highlights
- Staffordshire had total property sales of £2.82 billions in 2015.
- The total number of properties sold in 2015 in Staffordshire was 14,004
- The total volume of sales at district level was maximum for Stafford at £518 millions
- The average sales price in Staffordshire was £201 K, whereas median was £160 K
- The average sales price at district level was maximum for Lichfield at £273 K
- Similarly the median of sales price at district level was maximum for Lichfield at £200 K
- New Property sales in Staffordshire contributed 8.62% and Not New Property contributed 91.38%
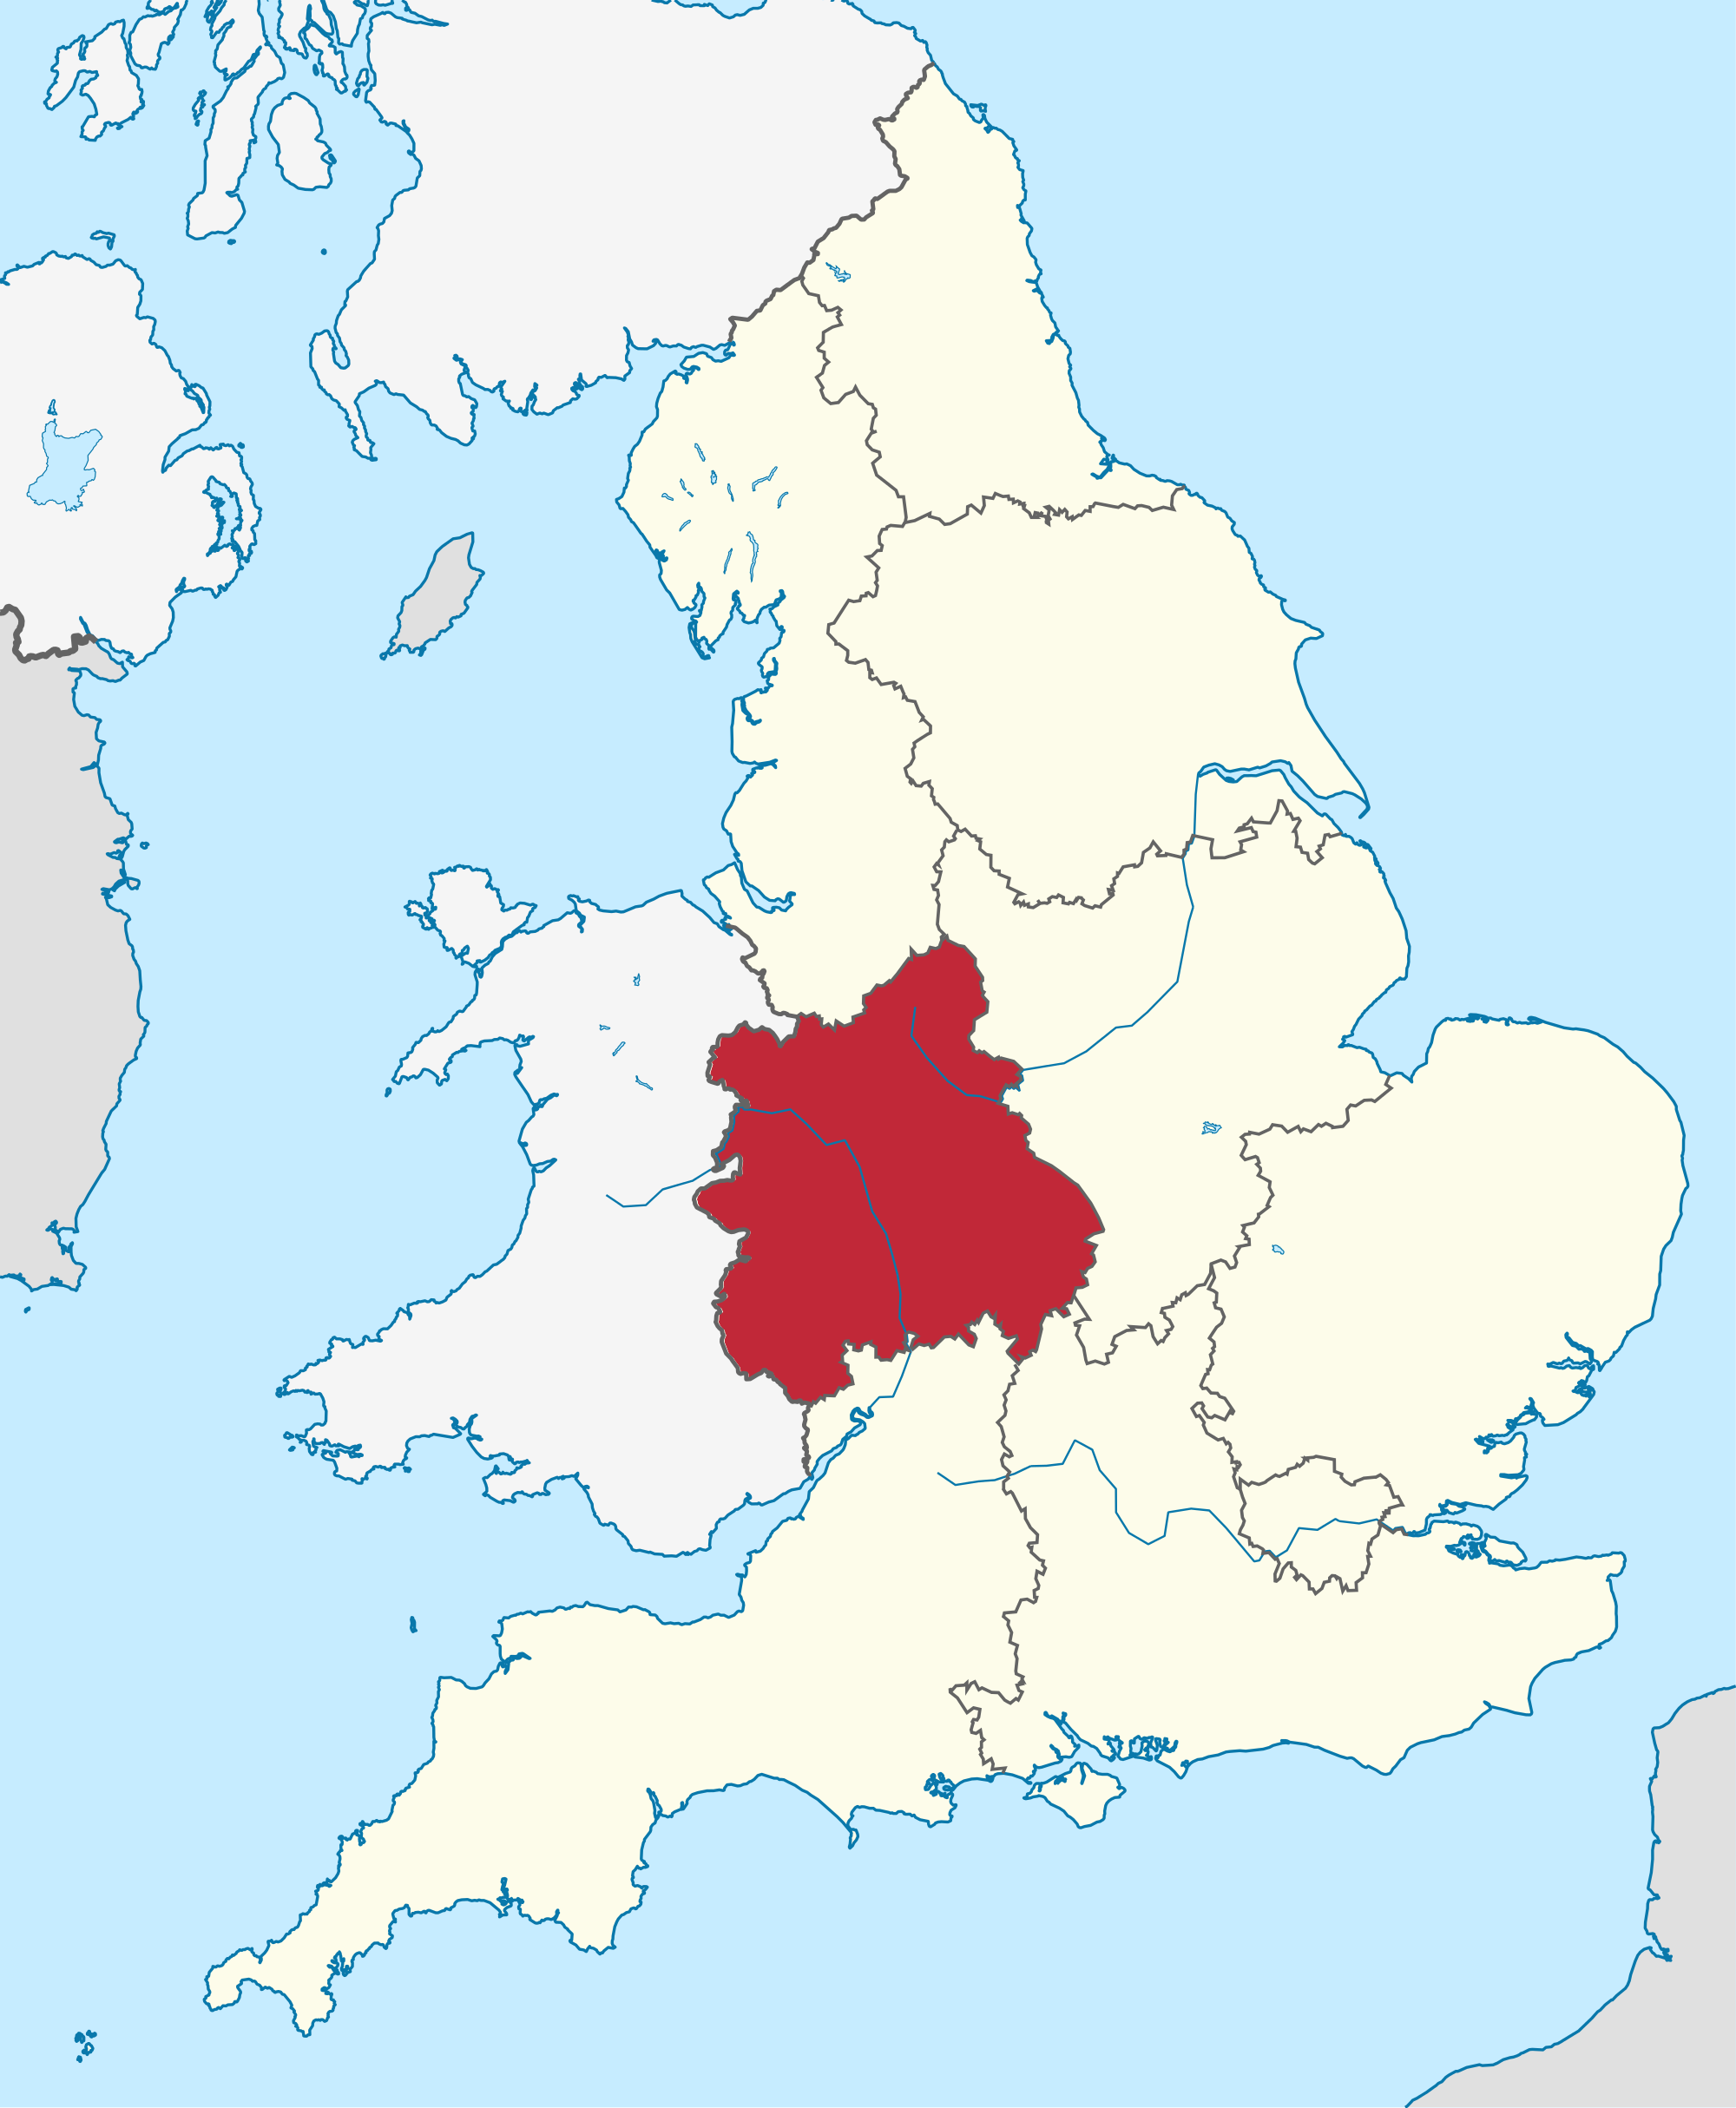
Staffordshire is one of the counties of West Midlands. The districts of Staffordshire are Stafford, Lichfield, East Staffordshire, South Staffordshire, Newcastle-Under-Lyme, Staffordshire Moorlands, Cannock Chase and Tamworth.
Total Sales By Districts
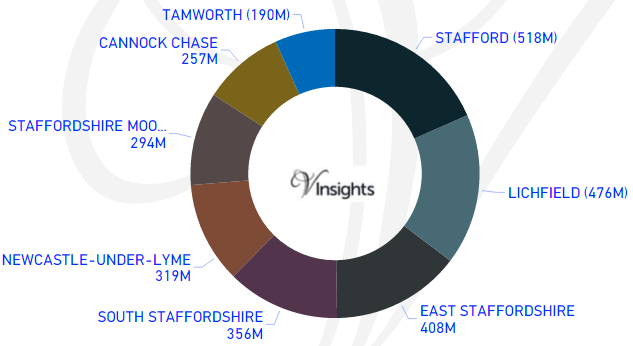
Staffordshire had total property sales of £2.82 billions, which was 15.15% of the West Midlands Property Market 2015.
The split across its districts is as follow:
- Stafford at £518 millions (18.4%)
- Lichfield at £476 millions (16.91%)
- East Staffordshire at £408 millions (14.47%)
- South Staffordshire at £356 millions (12.62%)
- Newcastle-Under-Lyme at £319 millions (11.32%)
- Staffordshire Moore at £294 millions (10.43%)
- Cannock Chase at £257 millions (9.11%)
- Tamworth at £190 millions (6.74%)
Total Sales By Property Type
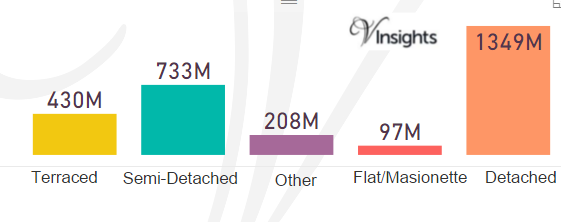
The split of £2.82 billions across the different property types in Staffordshire are :
- Detached at £1.35 billions (47.89%)
- Terraced at £430 millions (15.26%)
- Semi-Detached at £733 millions (26.01%)
- Flat/Maisonette at £97 millions (3.44%)
- Other at £208 millions (7.4%)
Total No Of Properties Sold By Property Type
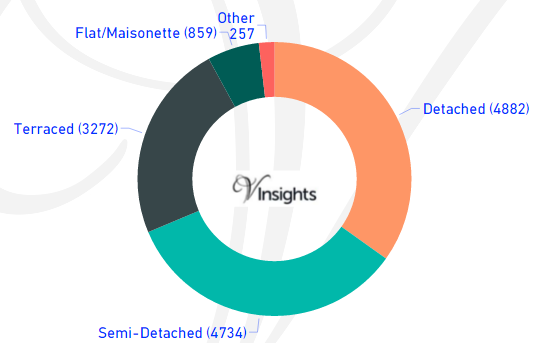
The total property sales of £2.82 billions in 2015 was spread over 14,004 properties.
- Terraced properties at 3272 (23.36%)
- Detached at 4882 (34.86%)
- Semi-Detached at 4734 (33.8%)
- Flat/Maisonette at 859 (6.13%)
- Others at 257 (1.84%)
Average & Median Sales Price
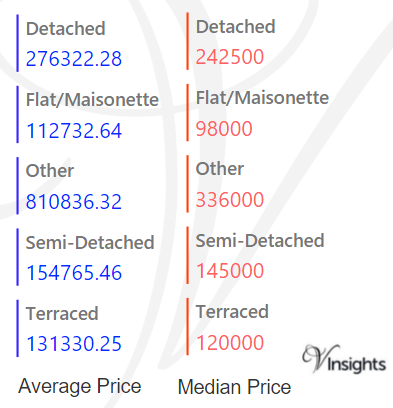
The average sales price in Staffordshire was £201 K. For the different property types it was:
- Detached at £276 K
- Semi-Detached at £155 K
- Terraced at £131 K
- Flat/Maisonette at £113 K
- Other at £811 K
Similarly median sales price in Staffordshire was £160 K. For the different property types it was:
- Detached at £243 K
- Semi-Detached at £145 K
- Terraced at £120 K
- Flat/Maisonette at £98 K
- Other at £336 K
Average & Median Sales Price By Districts
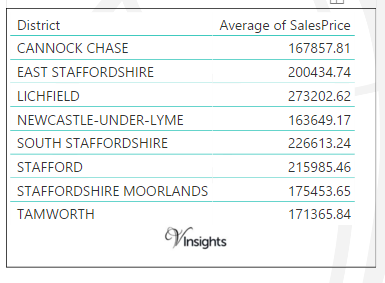
The average sales prices at district level in Staffordshire for 2015 is as follows:
- Lichfield was maximum at £273 K
- South Staffordshire at £227 K
- Stafford at £216 K
- East Staffordshire at £200 K
- Staffordshire Moorlands at £175 K
- Tamworth at £171 K
- Cannock Chase at £168 K
- with minimum for Newcastle-Under-Lyme at £164 K
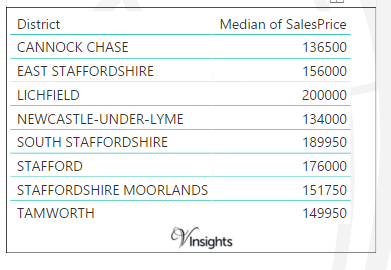
The median sales prices at district level in Staffordshire for 2015 is as follows:
- Lichfield was maximum at £200 K
- South Staffordshire at £190 K
- Stafford at £176 K
- East Staffordshire at £156 K
- Staffordshire Moorlands at £152 K
- Tamworth at £150 K
- Cannock Chase at £137 K
- with minimum for Newcastle-Under-Lyme at £134 K
New Vs Not New Property Statistics
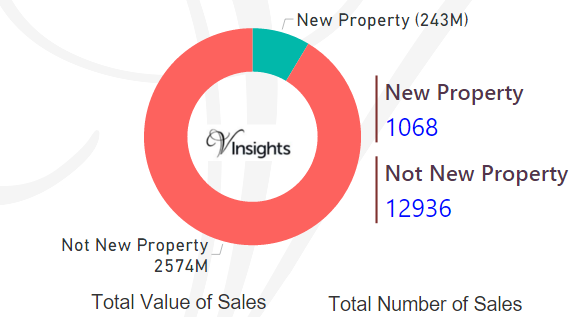
By Sales Values the split is as follows:
- New Properties contributed £243 millions (8.62%)
- Not New Property contributed £2.57 billions (91.38%)
By Total Number the split is as follows:
- New properties sold were 1068 (7.63%)
- Not new property sold were 12,936 (92.37%)
All Posts on Staffordshire

9ea677d8-f1df-46ce-a040-cd18d26c9720|0|.0|27604f05-86ad-47ef-9e05-950bb762570c
For 2016 Post : Shropshire Property Market 2016 at Postcode Level with School Details
Story Highlights
- Shropshire had total property sales of £1.2 billions in 2015
- The total number of properties sold in 2015 was 5,470
- The average sales price in Shropshire was £220 K, whereas median was £180 K
- New Property sales were 5.18% by value, whereas Not New Property contributed 94.82%
Shropshire has unitary authority status in West Midlands.
Total Sales By Property Type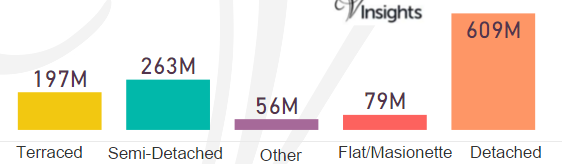
Shropshire had total property sales of £1.2 billions. It contributed 6.48% of the West Midlands Property Market 2015.
The split across the different property types was:
- Detached at £609 millions (50.6%)
- Semi-Detached at £263 millions (21.83%)
- Terraced at £197 millions (16.36%)
- Other at £56 millions (4.67%)
- Flat/Maisonette at £79 millions (6.54%)
Total No Of Properties Sold By Property Type
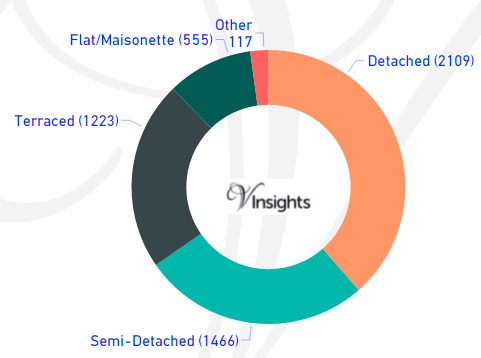
The total property sales of £1.2 billions in 2015 was spread over 5,470 properties.
- Detached at 2109 (38.56%)
- Terraced at 1223 (22.36%)
- Semi-Detached at 1466 (26.8%)
- Flat/Maisonette at 555 (10.15%)
- Others at 117 (2.14%)
Average & Median Sales Price
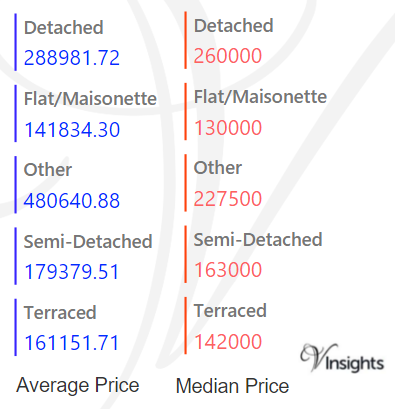
The average sales price in Shropshire was £220 K. For the different property types it was:
- Detached £289 K
- Semi-Detached £179 K
- Terraced £161 K
- Flat/Maisonette £142 K
- Other it is £481 K
The median sales price in Shropshire was £180 K. For the different property types it was
- Detached at £260 K
- Semi-Detached at £163 K
- Terraced at £142 K
- Flat/Maisonette at £130 k
- Other it is at £228 K
New Vs Not New Property Statistics

By Value Of Sales
- New Property contributed £150 millions (5.18%)
- where as Not New Property contributed £1055 millions (94.82%).
By Number Of Sales
- New properties sold were 654 (5.03%)
- Not new property sold were 4,816 (94.97%).
All Posts on West Midlands
f331ab10-b252-47c8-90a8-2c03fc2f3b37|0|.0|27604f05-86ad-47ef-9e05-950bb762570c
For 2016 Details: Herefordshire Property Market 2016 at Postcode Level with School Details
Story Highlights
- Herefordshire had total property sales of £729 millions in 2015
- The total number of properties sold in 2015 was 2,984
- The average sales price in Herefordshire was £244 K, whereas median was £205 K
- New Property sales were 5.18% by value, whereas Not New Property contributed 94.82%
Herefordshire has unitary authority status in West Midlands.
Total Sales By Property Type
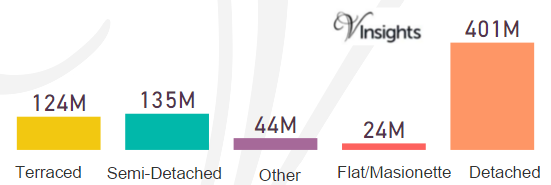
Herefordshire had total property sales of £729 millions. It contributed 3.92% of the West Midlands Property Market 2015.
The split across the different property types was:
- Detached at £401 millions (55.02%)
- Semi-Detached at £135 millions (18.56%)
- Terraced at £124 millions (17.03%)
- Other at £44 millions (6.04%)
- Flat/Maisonette at £24 millions (3.35%)
Total No Of Properties Sold By Property Type
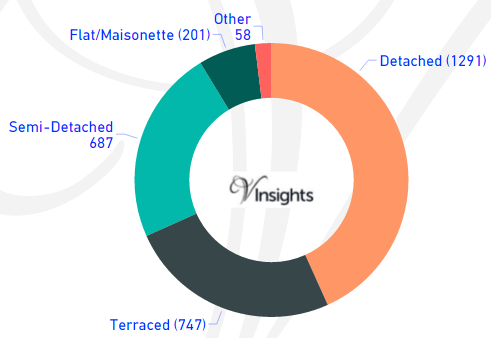
The total property sales of £729 millions in 2015 was spread over 2,984 properties.
- Detached at 1291 (43.26%)
- Terraced at 747 (25.03%)
- Semi-Detached at 687 (23.02%)
- Flat/Maisonette at 201(6.74%)
- Others at 58 (1.94%)
Average & Median Sales Price
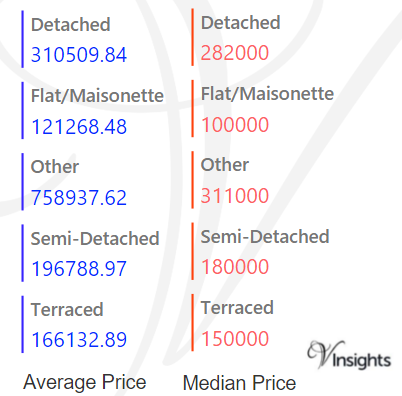
The average sales price in Herefordshire was £244 K. For the different property types it was:
- Detached at £311 K
- Semi-Detached £197 K
- Terraced at £166K
- Flat/Maisonette at £121 K
- Other it is at £759 K
The median sales price in Herefordshire was £205 K. For the different property types it was
- Detached at £282 K
- Semi-Detached at £180 K
- Terraced at £150 K
- Flat/Maisonette at £100k
- Other it is at £311 K
New Vs Not New Property Statistics
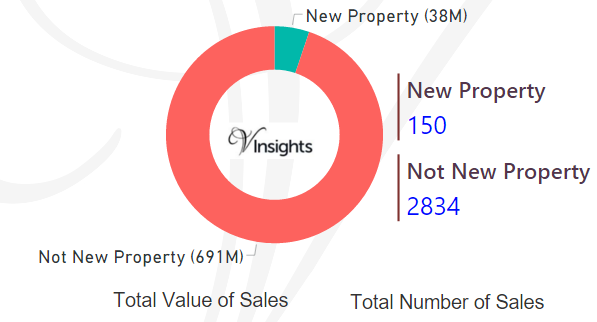
By Value Of Sales
- New Property contributed £38 millions (5.18%)
- where as Not New Property contributed £691 millions (94.82%)
By Number Of Sales
- New properties sold were 150 (5.03%)
- Not new property sold were 2,834 (94.97%)
All Posts on West Midlands
0e7f44d4-a218-4d2a-b597-504ba8ab40be|0|.0|27604f05-86ad-47ef-9e05-950bb762570c
For 2016 details - West Midlands Property Market 2016
Story Highlights
- West Midlands had total property sales of £19 Billions in 2015
- The number of properties sold was 88,925 properties
- The average property price was £209 K and the median was £160 K
- The sales price at the county level was maximum at Warwickshire £262 K
- New properties contributed 11.34% by sales value and not new 88.66%
West Midlands is one of the 9 principal areas of England. It comprises of Herefordshire, Shropshire, Telford and Wrekin, Staffordshire, Stoke-on-Trent,Warwickshire, West Midlands county , Worcestershire.
Total Value of Sales By Property Types
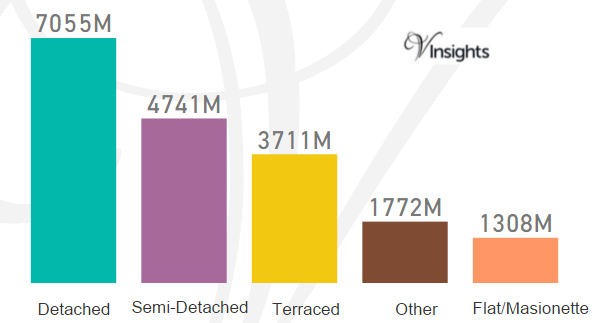
West Midlands had total property sales of £19 billions. It contributed 6.3% of the England and Wales Property Market 2015.
The split across the different property types was
- Detached at £7.06 billions (37.16%)
- Semi-Detached at £4.74 billions (24.95%)
- Terraced at £3.71 billions (19.5 %)
- Other at £1.77 billions (9.31%)
- Flat/Maisonette at £1.31 Billions (6.9%)
Total Sales By County
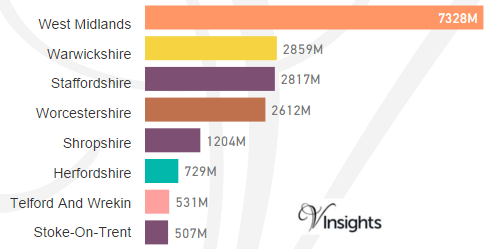
The total sales of £19 billions in 2015 was split across its counties as above.
Total Number of Sales By Property Types
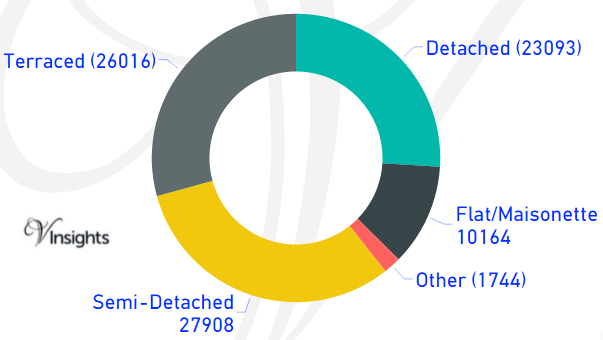
The total property sales of £19 billions in 2015 was spread over 88,925 properties.
- Semi-Detached at 27,908 (31.38%)
- Terraced at 26,016 (29.26%)
- Detached at 23,093 (25.97%)
- Flat/Maisonette at 10,164 (11.43%)
- Others at 1,744 (1.96%)
Average & Median Sales Price
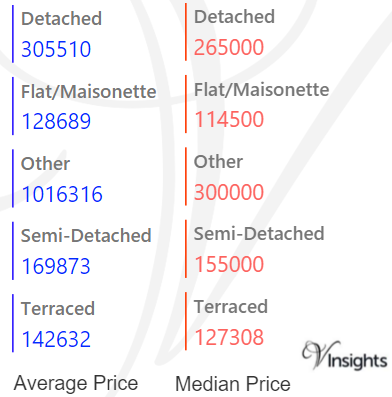
The average sales price in West Midlands was £209 K. For the different property types it was
- Detached £306 K
- Semi-Detached £170 K
- Terraced £143 K
- Flat/Maisonette £129 K
- Other it is £1.02 million.
The median sales price in West Midlands was £160 K. For the different property types it was
- Detached £265 at K
- Semi-Detached at £155 K
- Terraced at £127 K
- Flat/Maisonette at £115 K
- Other it is at £300 K
Average & Median Sales Price By County
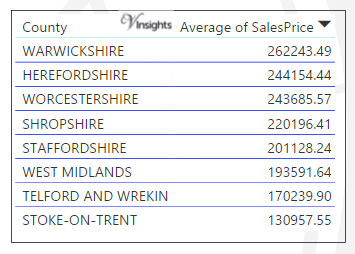
The average sales price at the county level in West Midlands 2015 is as above.
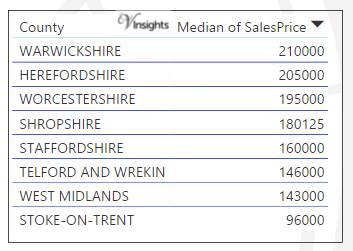
The median sales price at the county level in West Midlands 2015 is as above.
New Vs Not New Property Statistics
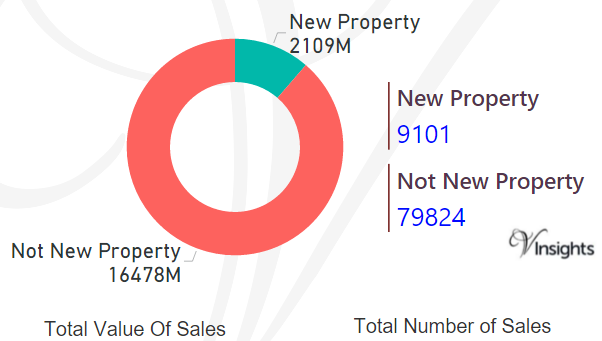
By Value Of Sales
- The sales value contributed by New Property was £2.11 billions (11.34%)
- where as Not New Property contributed £16.5 billions (88.66 %).
By Number Of sales
- New properties sold were 9,101 (10.23%)
- where as not new property sold were 79,824 (89.77%).
All England Posts
9de170f4-ff7d-4850-a485-872ca4b0247a|0|.0|27604f05-86ad-47ef-9e05-950bb762570c