For 2016 Details : Stoke-On-Trent Property Market 2016 at Postcode Level with School Details
Story Highlights
- Stoke-On-Trent had total property sales of £507 millions in 2015
- The total number of properties sold in 2015 was 3,872
- The average sales price in Stoke-On-Trent was £131 K, whereas median was £96 K
- New Property sales were 8.48% by value, whereas Not New Property contributed 91.52%
Total Sales By Property Type
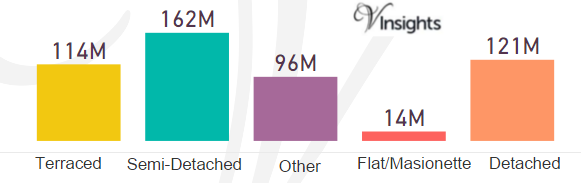
Stoke-On-Trent had total property sales of £507 millions. It contributed 2.73% of the West Midlands Property Market 2015.
- Detached at £121 millions (23.91%)
- Semi-Detached at £162 millions (31.86%)
- Terraced at £114 millions (22.57%)
- Other at £96 millions (18.89%)
- Flat/Maisonette at £14 millions (2.78%)
Total No Of Properties Sold By Property Type
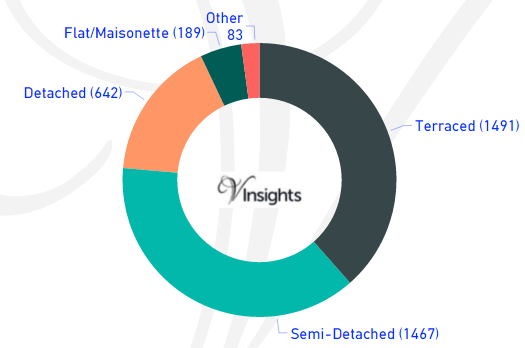
The total property sales of £507 millions in 2015 was spread over 3,872 properties.
- Detached at 642(16.58%)
- Terraced at 1491 (38.51%)
- Semi-Detached at 1467 (37.89%)
- Flat/Maisonette at 189 (4.88%)
- Others at 83 (2.14%)
Average & Median Sales Price
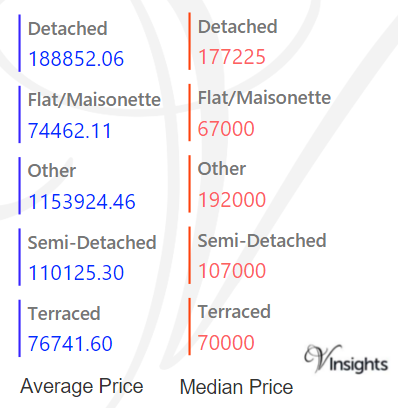
The average sales price in Stoke-On-Trent was £131 K. For the different property types it was:
- Detached at £189 K
- Semi-Detached £110 K
- Terraced at £77 K
- Flat/Maisonette at £75 K
- Other it is at £1.15 million
The median sales price in Stoke-On-Trent was £96 K. For the different property types it was
- Detached at £177 K
- Semi-Detached at £107 K
- Terraced at £70 K
- Flat/Maisonette at £67 K
- Other it is at £192 K
New Vs Not New Property Statistics
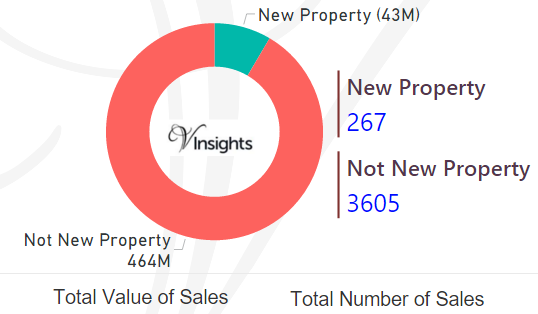
By Value Of Sales
- New Property contributed £43 millions (8.48%)
- where as Not New Property contributed £464 millions (91.52%)
By Number Of Sales
- New properties sold were 267 (6.9%)
- Not new property sold were 3,605 (93.1%)
All Posts on West Midlands

e3fb2e43-9ccb-4aff-b27f-67f2f1df9ccd|0|.0|27604f05-86ad-47ef-9e05-950bb762570c
Story Highlights
- Worcestershire had total property sales of £2.6 billions in 2015.
- The total number of properties sold in 2015 in Worcestershire was 10,718
- The total volume of sales at district level was maximum for Wychavon at £671 millions
- The average sales price in Worcestershire was £244 K, whereas median was £195 K
- The average sales price at district level was maximum for Bromsgrove at £287 K
- Similarly the median sales price at district level was maximum for Bromsgrove at £240 K
- New Property sales in Worcestershire contributed 14.94% and Not New Property contributed 85.06%
Worcestershire is one of the counties of West Midlands Region. The districts of Worcestershire are Wychavon, Bromsgrove, Worcester, Malvern Hills, Redditch and Wyre Forest.
Total Sales By Districts
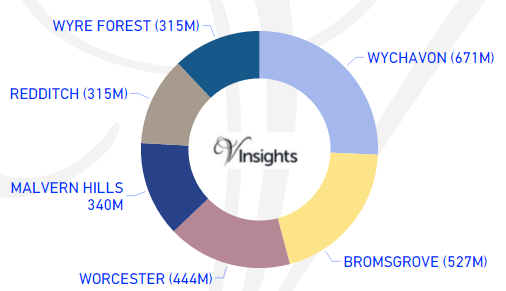
Worcestershire had total property sales of £2.6 billions, which was 14.05% of the West Midlands Property Market 2015.
The split across its districts is as follow:
- Wychavon at £671 millions (25.7%)
- Bromsgrove at £527 millions (20.17%)
- Worcester at £444 millions (17%)
- Mavern Hills at £340 millions (13%)
- Redditch at £315 millions (12.08%)
- Wyre Forest at £315 millions (12.06%)
Total Sales By Property Type
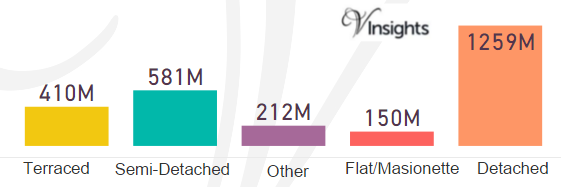
The split of £2.6 billions across the different property types in Worcestershire are :
- Detached at £1.26 billions (48.21%)
- Terraced at £410 millions (15.69%)
- Semi-Detached at £581 millions (22.26%)
- Flat/Maisonette at £150 millions (5.74%)
- Other at £212 millions (8.1%)
Total No Of Properties Sold By Property Type
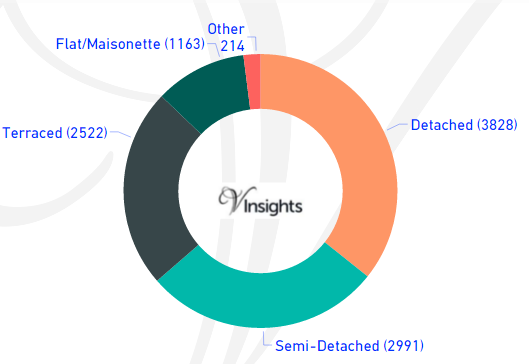
The total property sales of £2.6 billions in 2015 was spread over 10,718 properties.
- Terraced properties at 2522 (23.53%)
- Detached at 3828 (35.72%)
- Semi-Detached at 2991(27.91%)
- Flat/Maisonette at 1163 (10.85%)
- Others at 214 (2%)
Average & Median Sales Price
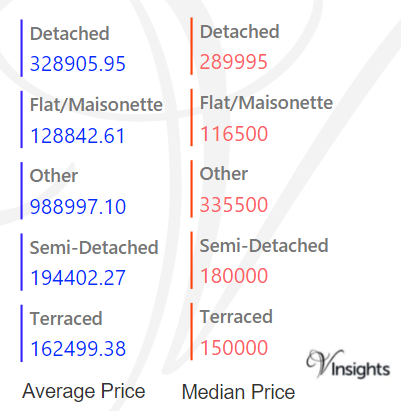
The average sales price in Worcestershire was £244 K. For the different property types it was:
- Detached at £329 K
- Semi-Detached at £194 K
- Terraced at £163 K
- Flat/Maisonette at £129 K
- Other at £989 K
Similarly median sales price in Worcestershire was £195 K. For the different property types it was:
- Detached at £290 K
- Semi-Detached at £180 K
- Terraced at £150 K
- Flat/Maisonette at £117 K
- Other at £336 K
Average & Median Sales Price By Districts
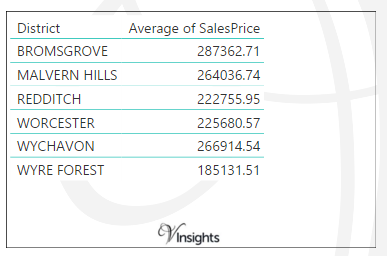
The average sales prices at district level in Worcestershire for 2015 is as follows:
- Bromsgrove at £287 K
- Malvern Hills at £264 K
- Redditch at £223 K
- Worcester at £226 K
- Wychavon at £267 K
- Wyre Forest at £185 K
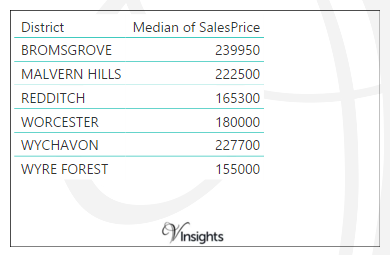
The median sales prices at district level in Worcestershire for 2015 is as follows:
- Bromsgrove at £240 K
- Malvern Hills at £223 K
- Redditch at £165 K
- Worcester at £180 K
- Wychavon at £228 K
- Wyre Forest at £155 K
New Vs Not New Property Statistics
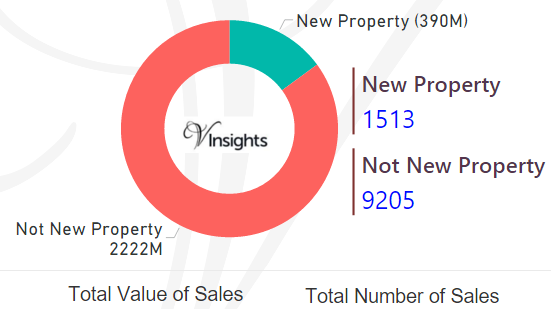
By Sales Values the split is as follows:
- New Properties contributed £390 millions (14.94%)
- Not New Property contributed £2.22 billions (85.06%)
By Total Number the split is as follows:
- New properties sold were 1513 (14.12%)
- Not new property sold were 9,205 (85.88%)
All Posts on Worcestershire
cbcf1913-052c-441e-85cb-8dfbab627cc1|0|.0|27604f05-86ad-47ef-9e05-950bb762570c
Story Highlights
- West Midlands County had total property sales of £7.33 billions in 2015.
- The total number of properties sold in 2015 in West Midlands County was 37,855
- The total volume of sales at district level was maximum for Birmingham at £2.92 Billions
- The average sales price in West Midlands was £194 K, whereas median was £143 K
- The average sales price at district level was maximum for Solihull at £297 K
- Similarly the median sales price at district level was maximum for Solihull at £233 K
- New Property sales in West Midlands contributed 9.58% and Not New Property contributed 90.42%
West Midlands is one of the counties of West Midlands. The districts of West Midlands are Birmingham, Solihull, Coventry, Dudley, Walsall, Sandwell and Wolverhampton.
Total Sales By Districts
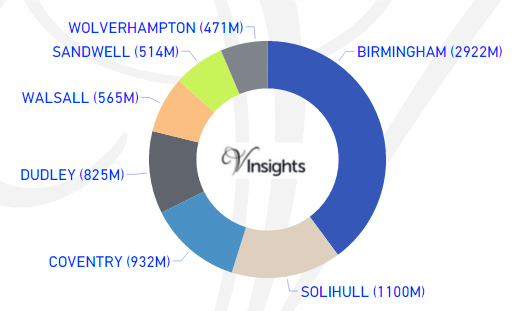
West Midlands County had total property sales of £7.33 billions, which was 39.43% of the West Midlands Property Market 2015.
The split across its districts is as follow:
- Birmingham at £2.92 Billions (39.87%)
- Solihull at £1.1 Billions (15.01%)
- Coventry at £932 millions (12.72%)
- Dudley at £825 millions (11.25%)
- Walsall at £565 millions (7.7%)
- Sandwell at £514 millions (7.02%)
- Wolverhampton at £471 millions (6.42%)
Total Sales By Property Type
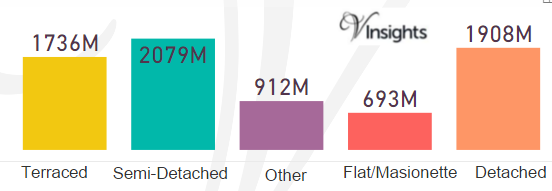
The split of £7.33 billions across the different property types in West Midlands County are :
- Detached at £1.91 billions (26.03%)
- Terraced at £1.74 billions (23.69%)
- Semi-Detached at £2.1 billions (28.37%)
- Flat/Maisonette at £693 millions (9.46%)
- Other at £912 millions (12.45%)
Total No Of Properties Sold By Property Type
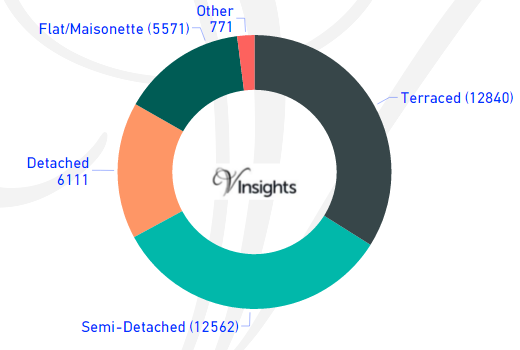
The total property sales of £7.33 billions in 2015 was spread over 37,855 properties.
- Terraced properties at 12840 (33.92%)
- Detached at 6111 (16.14%)
- Semi-Detached at 12562 (33.18%)
- Flat/Maisonette at 5571 (14.72%)
- Others at 771(2.04%)
Average & Median Sales Price
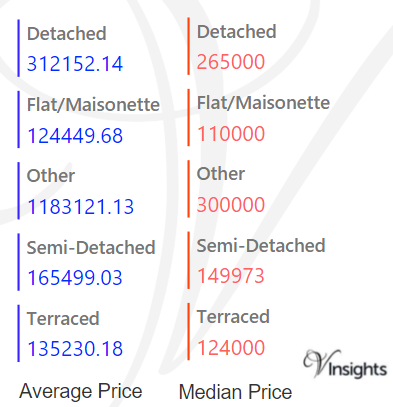
The average sales price in West Midlands County was £194 K. For the different property types it was:
- Detached at £312 K
- Semi-Detached at £166 K
- Terraced at £135 K
- Flat/Maisonette at £125 K
- Other at £1.18 millions
Similarly median sales price in West Midlands County was £143 K. For the different property types it was:
- Detached at £265 K
- Semi-Detached at £150 K
- Terraced at £124 K
- Flat/Maisonette at £110 K
- Other at £300 K
Average & Median Sales Price By Districts
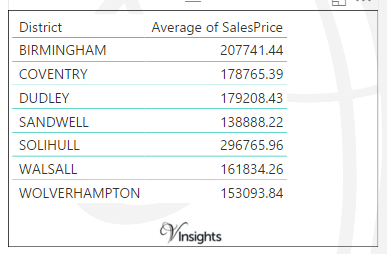
The average sales prices at district level in West Midlands County for 2015 is as follows:
- It was maximum for Solihull at £297 K
- Birmingham at £208 K
- Coventry at £179 K
- Dudley at £179 K
- Walsall at £162 K
- Wolverhampton at £153 K
- with minimum for Sandwell at £139 K
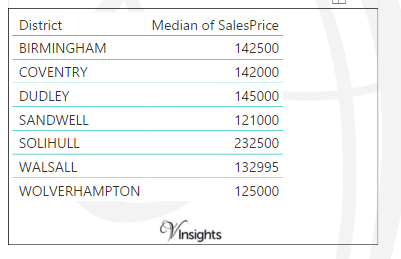
The median sales prices at district level in West Midlands County for 2015 is as follows:
- It was maximum for Solihull at £233 K
- Dudley at £145 K
- Birmingham at £143 K
- Coventry at £142 K
- Walsall at £133 K
- Wolverhampton at £125 K
- with minimum for Sandwell at £121 K
New Vs Not New Property Statistics
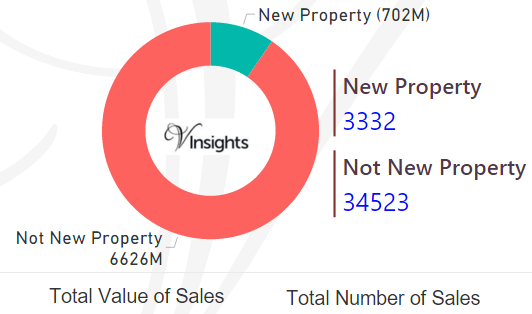
By Sales Values the split is as follows:
- New Properties contributed £702 millions (9.58%)
- Not New Property contributed £6.6 billions (90.42%)
By Total Number the split is as follows:
- New properties sold were 3332 (8.8%)
- Not new property sold were 34523 (91.2%)
All West Midlands County Posts
c3b0441e-f458-45bb-a83e-9f10f316c2c0|0|.0|27604f05-86ad-47ef-9e05-950bb762570c
Story Highlights
- Warwickshire had total property sales of £2.86 billions in 2015.
- The total number of properties sold in 2015 in Warwickshire was 10,903
- The total volume of sales at district level was maximum for Stratford-On-Avon at £882 millions
- The average sales price in Warwickshire was £262 K, whereas median was £210 K
- The average sales price at district level was maximum for Stratford-On-Avon at £343 K
- The median sales price at district level was also maximum for Stratford-On-Avon at £273 K
- New Property sales in Warwickshire contributed 14.49% and Not New Property contributed 85.51%
Warwickshire is one of the counties of West Midland. The districts of Warwickshire are Stratford-on-Avon, Warwick, Rugby, Nuneaton and Bedworth , North Warwickshire.
Total Sales By Districts
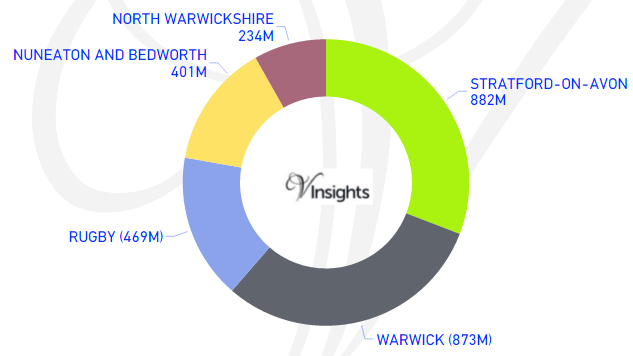
Warwickshire had total property sales of £2.86 billions, which was 15.38% of the West Midlands Property Market 2015.
The split across its districts is as follow:
- Stratford-on-Avon at £882 millions (30.84%)
- Warwick at £873 millions (30.55%)
- Rugby at £469 millions (16.39%)
- Nuneaton and Bedworth at £401 millions (14.03%)
- North Warwickshire at £234 millions (8.19%)
Total Sales By Property Type
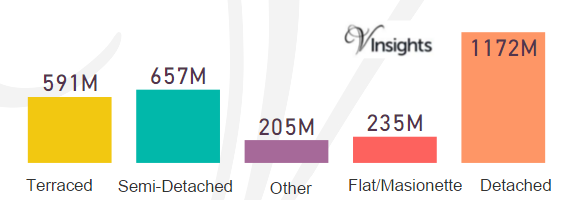
The split of £2.86 billions across the different property types in Warwickshire are :
- Detached at £1.17 billions (40.99%)
- Terraced at £591 millions (20.67%)
- Semi-Detached at £657 millions (22.97%)
- Flat/Maisonette at £235 millions (8.22%)
- Other at £205 millions (7.16%)
Total No Of Properties Sold By Property Type
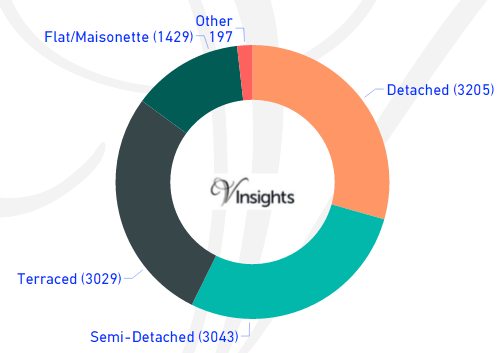
The total property sales of £2.86 billions in 2015 was spread over 10,903 properties.
- Terraced properties at 3029 (27.78%)
- Detached at 3205 (29.4%)
- Semi-Detached at 3043 (27.91%)
- Flat/Maisonette at 1429 (13.11%)
- Others at 197 (1.81%)
Average & Median Sales Price
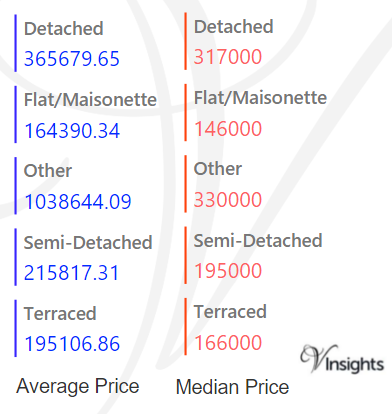
The average sales price in Warwickshire was £262 K. For the different property types it was:
- Detached at £366 K
- Semi-Detached at £216 K
- Terraced at £195 K
- Flat/Maisonette at £164 K
- Other at £1.04 millions
Similarly median sales price in Warwickshire was £210 K. For the different property types it was:
- Detached at £317 K
- Semi-Detached at £195 K
- Terraced at £166 K
- Flat/Maisonette at £146 K
- Other at £330 K
Average & Median Sales Price By Districts
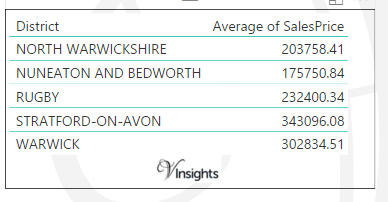
The average sales prices at district level in Warwickshire for 2015 is as follows:
- It was maximum for Stratford-On-Avon £343 K
- Warwick £303 K
- Rugby £232 K
- North Warwickshire £204 K
- with minimum for Nuneaton and Bedworth £176 K
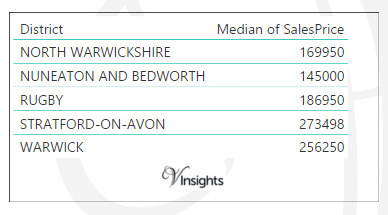
The median sales prices at district level in Warwickshire for 2015 is as follows:
- It was maximum for Stratford-On-Avon £273 K
- Warwick £256 K
- Rugby £187 K
- North Warwickshire £170 K
- with minimum for Nuneaton and Bedworth £145 K
New Vs Not New Property Statistics
By Sales Values the split is as follows:
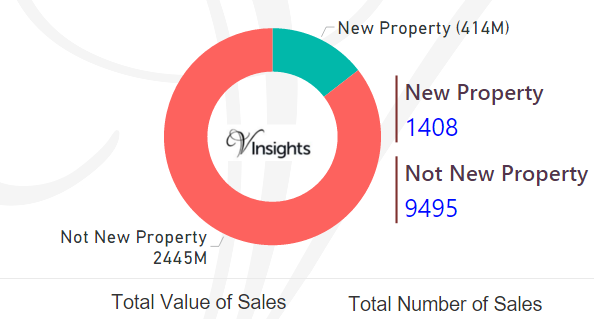
- New Properties contributed £414 millions (14.49%)
- Not New Property contributed £2.45 billions (85.51%)
By Total Number the split is as follows:
- New properties sold were 1408 (12.91%)
- Not new property sold were 9495 (87.09%)
All Posts on Warwickshire
7dbc807a-9959-43a4-a7d2-65efd09ccd2b|0|.0|27604f05-86ad-47ef-9e05-950bb762570c
For 2016 Details :Telford and Wrekin Property Market 2016 at Postcode Level with School Details
Story Highlights
- Telford and Wrekin had total property sales of £531 millions in 2015
- The total number of properties sold in 2015 was 3,119 properties
- The average sales price in Telford and Wrekin was £170 K, whereas median was £146 K
- New Property sales were 24.23% by value, whereas Not New Property contributed 75.77%
Telford and Wrekin has unitary authority status in West Midlands.
Total Sales By Property Type
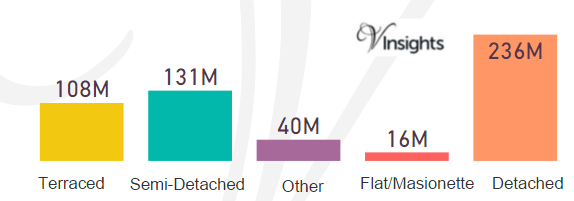
Telford and Wrekin had total property sales of £531 millions. It contributed 2.86% of the West Midlands Property Market 2015.
The split across the different property types was:
- Detached at £236 millions (44.44%)
- Semi-Detached at £131 millions (24.72%)
- Terraced at £108 millions (20.38%)
- Other at £40 millions (7.46%)
- Flat/Maisonette at £16 millions (3%)
Total No Of Properties Sold By Property Type
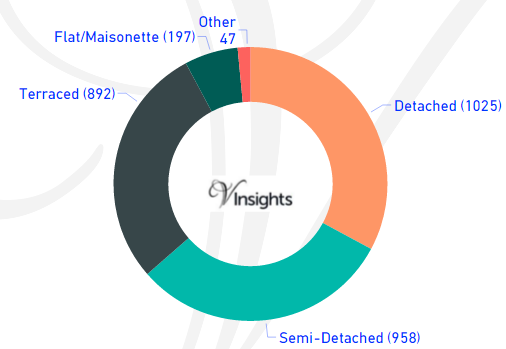
The total property sales of £531 millions in 2015 was spread over 3119 properties.
- Detached at 1025 (32.86%)
- Terraced at 892 (28.6%)
- Semi-Detached at 958(30.71%)
- Flat/Maisonette at 197(6.32%)
- Others at 47 (1.51%)
Average & Median Sales Price
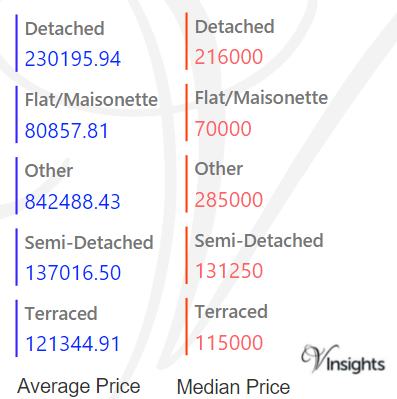
The average sales price in Telford and Wrekin was £170 K. For the different property types it was:
- Detached at £230 K
- Semi-Detached £137 K
- Terraced at £121 K
- Flat/Maisonette at £81 K
- Other it is at £843 K
The median sales price in Telford and Wrekin was £146 K. For the different property types it was
- Detached at £216 K
- Semi-Detached at £131 K
- Terraced at £115 K
- Flat/Maisonette at £70 K
- Other it is at £285 K
New Vs Not New Property Statistics
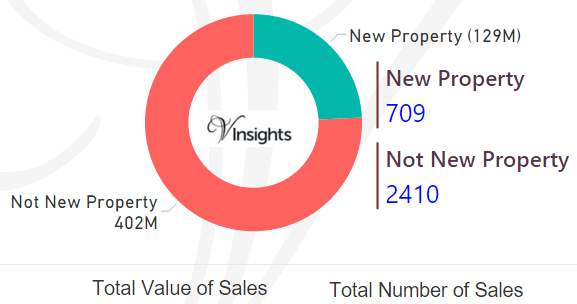
By Value Of Sales
- New Property contributed £129 millions (24.23%)
- where as Not New Property contributed £402 millions (75.77%)
By Number Of Sales
- New properties sold were 709 (22.73%)
- Not new property sold were 2410 (77.27%)
All Posts on West Midlands
82c695db-93cd-4d01-ac7f-691dd47e37a1|0|.0|27604f05-86ad-47ef-9e05-950bb762570c