Story Highlights
- Bexley had total Property Sales of £1.35 billions in 2016.
- The total number of properties sold in year 2016 was 3697
- The Average property price was £365 K in Bexley, while Median was £325 K
- Not New Property contributed 94.01% by value and New Property contributed 5.99%
- Stamp duty changes caused monthly spike in March
- Brexit and Stamp duty changes did not have negative impact, witness 6.3% growth in total sales value
Bexley is one of the Boroughs of East London. It had total Property Sales of £1.35 billions in 2016 which was 8.22% of East London Property Market 2016.
Total Sales By Property Type
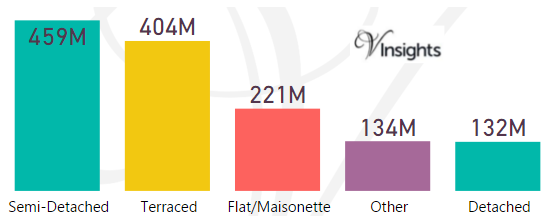
The property sales of £1.35 billions is split across the different property types as:
- Semi-Detached £459 millions (34.01%)
- Terraced £404 millions (29.9%)
- Flat/Maisonette £221 millions (16.4%)
- Other £134 millions (9.91%)
- Detached £132 millions (9.78%).
Year on Year Comparison : Compared to Bexley Property Market 2015 in 2016
- All the property types have shown growth in sales except Flat/Maisonette.
- Flat/Maisonette has shown sales decrease of 7.9% year on year
Bexley Property Market at Postcode level
| Postcode |
Coverage Area
|
Local Authority Area |
| BR6 |
Orpington, Locksbottom, Farnborough, Green Street Green, Chelsfield, Downe, Pratt's Bottom, Well Hill
|
Bromley, Bexley, Sevenoaks |
| DA1 |
Dartford, Crayford, Barnes Cray
|
Bexley, Dartford |
| DA5 |
Bexley, parts of Albany Park and Joyden's Wood
|
Bexley, Dartford |
| DA6 |
Bexleyheath, Upton
|
Bexley |
| DA7 |
Bexleyheath (north), Barnehurst
|
Bexley |
| DA8 |
Erith, Northumberland Heath, Slade Green
|
Bexley |
| DA14 |
Sidcup, Foots Cray, North Cray, Longlands, Ruxley, part of Albany Park
|
Bexley, Bromley |
| DA15 |
Sidcup (north), Blackfen, Lamorbey, Longlands
|
Bexley, Greenwich |
| DA16 |
Welling, Falconwood, East Wickham
|
Bexley, Greenwich |
| DA17 |
Belvedere, Lessness Heath
|
Bexley |
| DA18 |
Erith Marshes, Thamesmead (part)
|
Bexley |
| SE2 |
Abbey Wood, West Heath, Crossness, Thamesmead (part), Plumstead (part)
|
Bexley, Greenwich |
| SE9 |
Eltham, Mottingham, New Eltham, Avery Hill (part), Falconwood (part), Sidcup (part), Chinbrook (part), Longlands (part) Kidbrooke (part), Shooter's Hill (part)
|
Bexley, Bromley, Greenwich, Lewisham |
| SE26 |
Sydenham, Crystal Palace (part)
|
Bromley, Lewisham, Southwark, Bexley |
| SE28 |
Thamesmead
|
Bexley, Greenwich |
For property market details at post code level please click on Postcode in the table above.
Month-wise Break-up of Total Sales
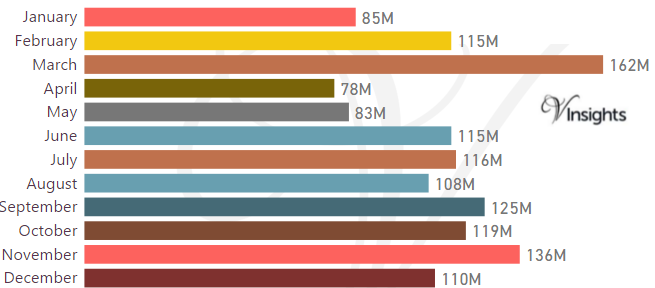
Stamp Duty Hike Impact
- March had property sale spike of £162 millions compared to £115 millions in Feb
- The impetus for it was to avoid the extra 3% in Stamp Duty Tax applicable on buying an additional home, being applicable from April 1 2016
Brexit Impact
- Brexit took place on 23rd June 2016.
- As can be observed from the month-wise break-up there does not seem to have been dip in property sales in the immediate aftermath of Brexit
- Year on Year the property market for Bexley has shown growth of 6.3% over 2015 so there was no immediate Brexit impact
Total No Of Properties Sold By Property Type
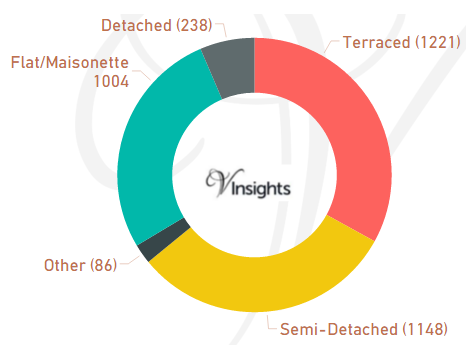
In Bexley the total number of properties sold in year 2016 was 3697. The breakdown by different property types are:
- Terraced 1221(33.03%)
- Semi-Detached 1148(31.05%)
- Other 86(2.33%)
- Flat/Maisonette 1004(27.16%)
- Detached 238(6.44%).
Year on Year Comparison : Compared to Bexley Property Market 2015 in 2016
- Total number of property sales in Bexley has decreased by 543 which was 12.81% decline
- All property types have shown decline in number of properties sold except property type Other
- Other has shown significant increase of 79%.
Average & Median Sales Price
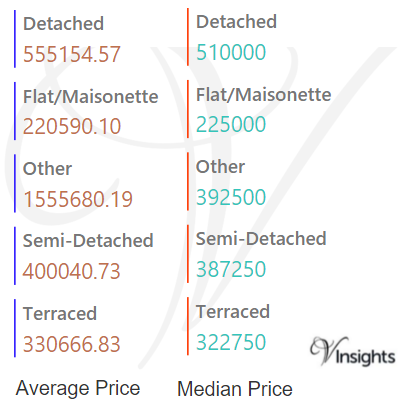
In 2016 the Average property price was £365 K in Bexley. The average property price for the different property types are:
- Detached £555 K
- Flat/Maisonette £221 K
- Other £1.56 millions
- Semi-Detached £400 K
- Terraced £331 K
The Median Price was £325 K. The median property price for the different property types are:
- Detached £510 K
- Flat/Maisonette £225 K
- Other £393 K
- Semi-Detached £387 K
- Terraced £323 K
Year on Year Comparison : Compared to Bexley Property Market 2015
- The average and median sales price across all property types have gone up except for others
New Vs Not New Property Statistics
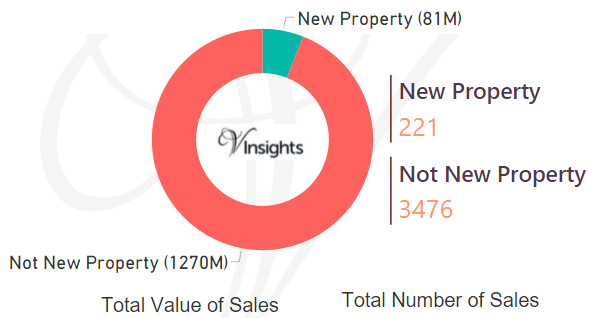
By Value Of Sales
- Not New Property Contributed £1.27 billion (94.01%)
- New Property £81 millions (5.99%)
By Number Of Sales
- The number of Not New Property sold was 3476(94.02%)
- The number of New Properties sold was 221(5.98%)
Year on Year Comparison : Compared to Bexley Property Market 2015 in 2016
- New property market share in property market has gone down in 2016 over 2015
All London Posts
02d0fa1f-5fd4-450b-8b12-abde5b36c4fe|0|.0|27604f05-86ad-47ef-9e05-950bb762570c