Story Highlights
- Chiltern had total property sales of £891 millions in 2016
- The total number of properties sold in 2016 was 1,484 properties
- The average sales price in Chiltern was £601 K K, whereas median was £505 K
- New Property sales were 7.24% by value, where as Not New 92.76%
- Stamp duty hike caused monthly spike in March
- Brexit coupled with Stamp Duty Hike had negative impact on Chiltern Property Market in 2016, causing decline of 13.83% over 2015
Chiltern is one of the districts of Buckinghamshire
Total Sales By Property Type
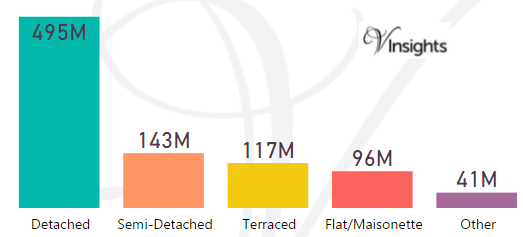
Chiltern had total property sales of £891 millions which was 20.24% of the total Buckinghamshire Property Market 2016
The split £891 millions across the different property types are:
- Detached £495 millions (55.52%)
- Semi-Detached £143 millions (16%)
- Terraced £117 millions (13.14%)
- Flat/Maisonette £96 millions (10.77%)
- Other £41 millions (4.58%)
Chiltern Property Market at Postcode level
| Postcode |
Coverage Area |
School |
Local Authority Area |
| HP5 |
Chesham,Ashley Green,Bellingdon,Botley,Chartridge, Hawridge,Latimer,Lye Green,Newtown,Waterside,Whelp ley Hill |
Details |
Chiltern |
| HP6 |
Amersham(north),Chesham Bois,Hyde Heath,Little Cha lfont |
Details |
Chiltern |
| HP7 |
Amersham (south),Coleshill,Little Chalfont,Little Missenden,Penn Street,Winchmore Hill |
Details |
Chiltern |
| HP8 |
Chalfont St Giles |
Details |
Chiltern |
| HP9 |
Beaconsfield,Forty Green,Holtspur,Jordans,Knotty G reen,Seer Green |
Details |
South Bucks, Chiltern |
| HP10 |
High Wycombe,Flackwell Heath,Handy Cross,Hedsor,Lo udwater,Penn,Tylers Green,Wooburn,Wooburn Green,Wo oburn Moor |
Details |
Wycombe, Chiltern |
| HP15 |
Cryers Hill,Great Kingshill,Hazlemere,Holmer Green ,Hughenden Valley |
Details |
Wycombe, Chiltern |
| HP16 |
Great Missenden,Ballinger,The Lee,Little Hampden,L ittle Kingshill,Prestwood,South Heath |
Details |
Chiltern, Wycombe |
| HP23 |
Aldbury,Buckland Common,Cholesbury,Hastoe,Long Mar ston,Marsworth,New Mill,Puttenham,St Leonards,Trin g,Wigginton,Wilstone |
Details |
Dacorum, Chiltern |
| SL9 |
Gerrards Cross,Chalfont St Peter,Chalfont Common, Horn Hill |
Details |
South Bucks, Chiltern |
| WD3 |
Rickmansworth,Chorleywood,Croxley Green,Loudwater, Mill End,Maple Cross,Sarratt,Batchworth,Chenies,Ha refield(part),West Hyde,Heronsgate, Chandlers Cros s |
Details |
Three Rivers, Chiltern,Hillingdon |
Month-wise Break-up of Total Sales
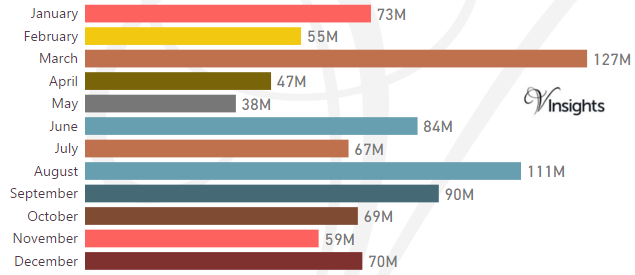
Some of the insights based on the £891 millions month-wise break-down :
Stamp Duty Hike Impact
- March had property sale spike of £127 millions compared to £55 millions in Feb
- The impetus for it was to avoid the extra 3% in Stamp Duty Tax applicable on buying an additional home, being applicable from April 1 2016
Brexit Impact
- Brexit took place on 23rd June 2016.
- Year on Year decline has been 13.83% in 2016 over 2015
- Brexit coupled with Stamp Duty Hike had negative impact on Chiltern Property Market in 2016
Total No Of Properties Sold By Property Type
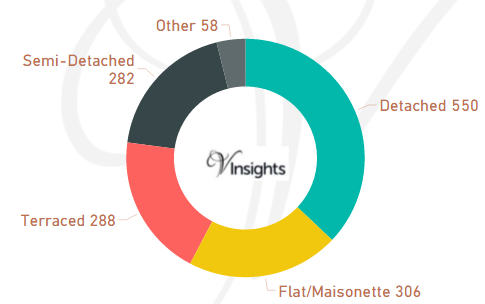
Chiltern had total property sales of 1,484. The split across different property types are:
- Detached 550 (37.06%)
- Flat/Maisonette 306 (20.62%)
- Terraced 288 (19.41%)
- Semi-Detached 282 (19%)
- Other 58 (3.91%)
Average & Median Sales Price
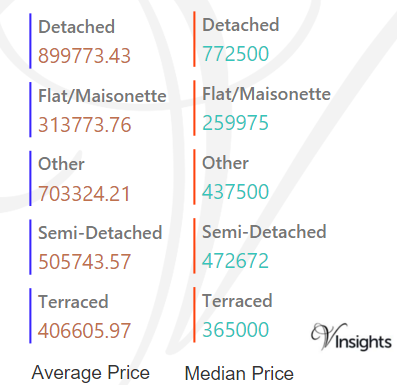
The average sales price in Chiltern was £601 K and for the different property types it was:
- Detached £900 K
- Semi-Detached £506 K
- Terraced £407 K
- Flat/Maisonette £314 K
- Other it is £703 K
Similarly median sales price in Chiltern was £505 K and for the different property types are:
- Detached £773 K
- Semi-Detached £473 K
- Terraced £365 K
- Flat/Maisonette £260 K
- Other it is £438 K
New Vs Not New Property Statistics
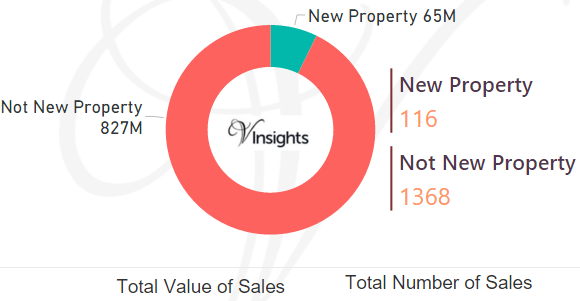
By Sales Values the split is as follows:
- New Property contributed £65 millions (7.24%)
- Not New Property contributed £827 millions (92.76%)
By Total Number the split is as follows:
- New properties sold were 116 (7.82%)
- Not new property sold were 1368 (92.18%)
All Buckinghamshire Posts

Reference
HP Postcode Area As Per Wikipedia
1939aeca-9f62-4f42-80e9-256fb0c62d83|0|.0|27604f05-86ad-47ef-9e05-950bb762570c