London TW Postcode Area - TW10, TW11, TW12, TW13, TW14, TW15, TW16, TW17, TW18, TW19, TW20 Property Market 2017

Please click here for the updated version of this post

This Post covers 


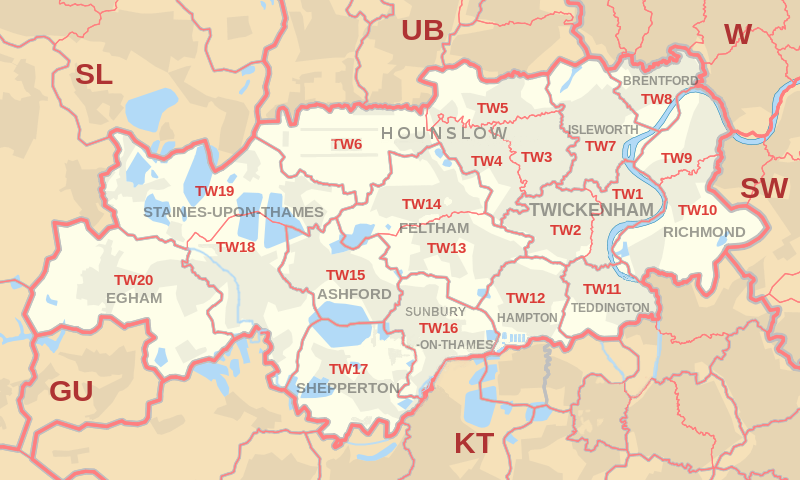
Coverage Area of Postcode TW10 to TW20

Postcode                 Coverage Area          Local Authority Area
TW10 Ham, Petersham, Richmond Hill, North Sheen (south), Richmond Park Kingston Upon Thames, Richmond upon Thames
TW11 Teddington, Fulwell (east), Bushy Park Richmond Upon Thames
TW12 Hampton, Hampton Hill, Fulwell (west) Richmond Upon Thames
TW13 Feltham, Hanworth Hounslow, Richmond upon Thames
TW14 Feltham (part of the station area), North Feltham, East Bedfont, Hatton Hillingdon, Hounslow, Spelthorne
TW15 Ashford Hounslow, Spelthorne
TW16 Sunbury-on-Thames Elmbridge, Richmond Upon Thames, Spelthorne
TW17 Shepperton, Upper Halliford, Charlton, Littleton Elmbridge, Spelthorne
TW18 Staines-upon-Thames, Egham Hythe, Laleham Runnymede, Spelthorne, Windsor and Maidenhead
TW19 Stanwell, Stanwell Moor, Wraysbury, Sunnymeads, Hythe End Hillingdon, Spelthorne, Windsor and Maidenhead
TW20 Egham, Englefield Green, Thorpe Runnymede


  • M represents Million Pounds
  • Total value includes Property Type Other apart from Detached, Semi-Detached, Terraced, Flat/Masionette


Postcode Detached Semi-Detached Terraced Flat
TW10 £1794K £1432K £950K £984K
TW11 £1603K £1123K £810K £461K
TW12 £1002K £691K £559K £381K
TW13 £401K £393K £349K £246K
TW14 £513K £396K £343K £237K
TW15 £485K £426K £371K £276K
TW16 £755K £491K £421K £289K
TW17 £697K £480K £403K £302K
TW18 £647K £442K £403K £284K
TW19 £690K £381K £342K £240K
TW20 £769K £470K £457K £302K


Postcode Detached Semi-Detached Terraced Flat
TW10 £1550K £1026K £718K £657K
TW11 £1375K £1054K £800K £415K
TW12 £910K £670K £514K £350K
TW13 £385K £385K £346K £262K
TW14 £470K £392K £360K £255K
TW15 £460K £422K £365K £282K
TW16 £650K £450K £380K £279K
TW17 £640K £475K £390K £305K
TW18 £620K £421K £392K £285K
TW19 £670K £380K £350K £248K
TW20 £700K £425K £367K £280K


Postcode Detached SemiDetached Terraced Flat
TW10 £1159K £837K £604K £886K
TW11 £825K £323K £185K £174K
TW12 £318K £207K £196K £137K
TW13 £64K £61K £47K £60K
TW14 £98K £52K £61K £50K
TW15 £140K £69K £66K £40K
TW16 £299K £143K £137K £84K
TW17 £187K £102K £121K £66K
TW18 £226K £87K £90K £63K
TW19 £220K £63K £65K £56K
TW20 £348K £168K £257K £91K
For example
  • Say the average detached property price for postcode XYZ is £300 K and ST. DEV. is £30 K.
  • It means that most detached properties in postcode XYZ (about 68%) has price within one ST. Dev. i.e. the price range is  £270K - £330K.
  • All-most all detached property price (95%) in postcode XYZ lie between two ST. Dev.  i.e. £240 K - £360 K


Postcode Detached Semi-Detached Terraced Flat
TW10 18 47 80 181
TW11 22 64 116 169
TW12 36 78 104 74
TW13 8 90 122 138
TW14 8 89 55 64
TW15 78 147 73 93
TW16 62 95 77 84
TW17 63 59 50 42
TW18 70 105 83 127
TW19 55 56 57 65
TW20 56 99 80 74


The Table below gives in percentage, the total number of properties purchased as Buy-To-Let:
Postcode Detached Semi-Detached Terraced Flat
TW10 28% 0% 6% 9%
TW11 9% 0% 4% 8%
TW12 3% 5% 4% 4%
TW13 25% 7% 11% 14%
TW14 13% 16% 13% 9%
TW15 8% 4% 7% 6%
TW16 2% 3% 5% 6%
TW17 3% 3% 2% 7%
TW18 4% 4% 5% 9%
TW19 7% 9% 9% 6%
TW20 7% 5% 15% 14%
*Buy-to-let consists of Buy-to-lets (where they can be identified by a Mortgage) ,transfers to non-private individuals,  transfers under a power of sale/repossessions


Hospital Postcode Town/City
West Middlesex University Hospital TW7 6AF Isleworth
Richmond Royal Hospital TW9 2TE  
Cassel Hospital TW10 7JF Richmond
St. George's At Teddington Memorial Hospital TW11 0JL Teddington
Teddington Memorial Hospital TW11 0JL Teddington
Ashford Hospital TW15 3AA Ashford


Schools for Postcode Area TW


Property Posts for Postcode Area TW


All TW Postcodes Yearly & Trend Analysis Posts

 Reference

TW Postcode Area As Per Wikipedia

Comments are closed