Story Highlights
- Cumbria had total property sales of £1.67 billions in 2015.
- The total number of properties sold in 2015 in Cumbria was 9,370
- The total volume of sales at district level was maximum for South Lakeland at £544 millions
- The average sales price in Cumbria was £179 K, whereas median was £148 K
- The average sales price at district level was maximum for South Lakeland at £253 K
- Similarly the median of sales price at district level was maximum for South Lakeland at £208 K
- New Property sales in Cumbria contributed 11.38% and Not New Property contributed 88.62%
Cumbria is one of the counties of North West England. The districts in Cumbria are South Lakeland, Carlisle, Allerdale, Eden, Barrow-In-Furness, Copeland.
Total Sales By Districts
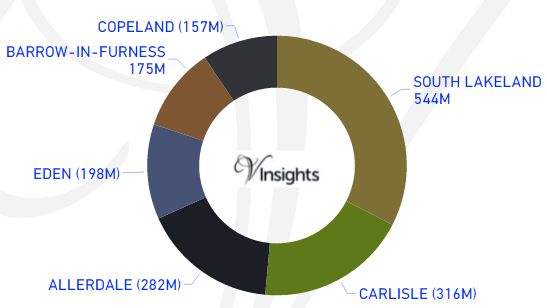
Cumbria had total property sales of £1.67 billions which was 7.72% of the North West Property Market 2015.
The split across its districts is as follow:
- South Lakeland at £544 millions (32.54%)
- Carlisle at £ 316 millions (18.91%)
- Allerdale at £282 millions (16.86%)
- Eden at £198 millions (11.83%)
- Barrow-In-Furness at £175 millions (10.47%)
- Copeland at £157 millions (9.39%)
Total Sales By Property Type
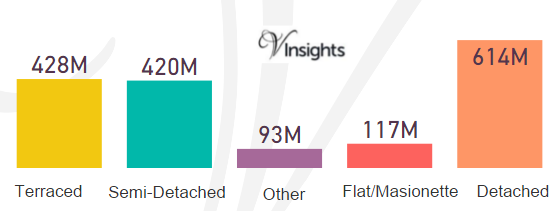
The split of £1.67 billions across the different property types in Cumbria are :
- Detached at £614 millions (36.73%)
- Terraced at £428 millions (25.57%)
- Semi-Detached at £420 millions (25.13%)
- Flat/Maisonette at £117 millions (7.03%)
- Other at £93 millions (5.54%)
Total No Of Properties Sold By Property Type
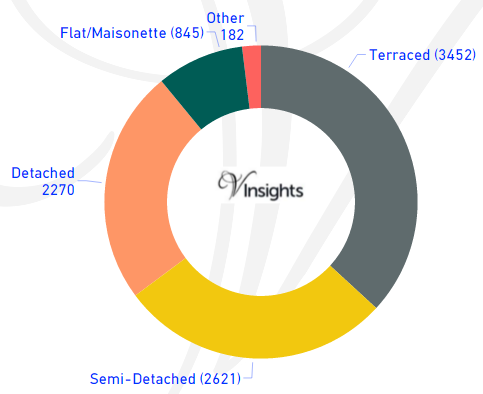
The total property sales of £1.67 billions in 2015 was spread over 9,370 properties.
- Terraced properties at 3452 (36.84%)
- Detached at 2270 (24.23%)
- Semi-Detached at 2621 (27.97%)
- Flat/Maisonette at 845 (9.02%)
- Others at 182 (1.94%)
Average & Median Sales Price
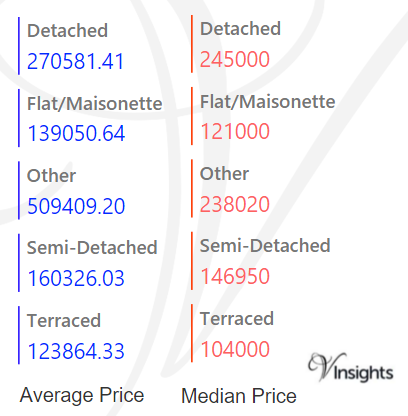
The average sales price in Cumbria was £179 K.For the different property types it was:
- Detached at £271 K
- Semi-Detached at £160 K
- Terraced at £124 K
- Flat/Maisonette at £139 K
- Other at £509 K
Similarly median sales price in Cumbria was £148 K.For different property types it was:
- Detached at £245 K
- Semi-Detached at £147 K
- Terraced at £104 K
- Flat/Maisonette at £121 K
- Other at £238 K
Average & Median Sales Price By Districts
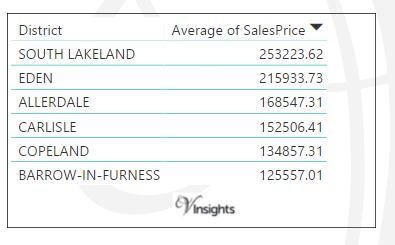
The average sales prices at district level in Cumbria for 2015 is as follows:
- South Lakeland was maximum at £253 K
- Eden at £216 K
- Allerdale at £169 K
- Carlisle at £153 K
- Copeland at £135 K
- with minimum for Barrow-In-Furness at £126 K
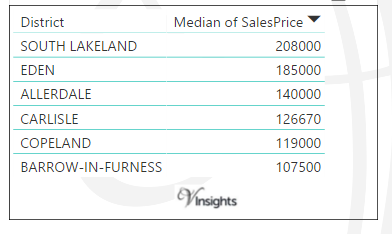
The median sales prices at district level in Cumbria for 2015 is as follows:
- South Lakeland was maximum at £208 K
- Eden at £185 K
- Allerdale at £140 K
- Carlisle at £127 K
- Copeland at £119 K
- with minimum for Barrow-In-Furness at £108 K
New Vs Not New Property Statistics
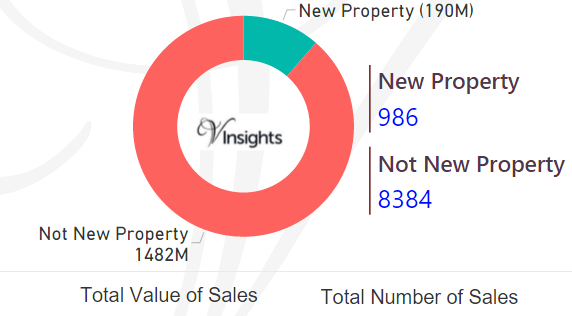
By Sales Values the split is as follows:
- New Properties contributed £190 millions (11.38%)
- Not New Property contributed £1.48 billions (88.62%)
By Total Number the split is as follows:
- New properties sold were 986 (10.52%)
- Not new property sold were 8,384 (89.48%).
All Cumbria Posts

1cb51e53-e928-4442-adea-a6f077de5d4e|0|.0|27604f05-86ad-47ef-9e05-950bb762570c
For 2016 Details : Cheshire West and Chester Property Market 2016 at Postcode Level with School Details
Story Highlights
- Cheshire West and Chester had total property sales of £1.48 millions in 2015
- The total number of properties sold in 2015 was 6,501
- The average sales price in Cheshire West and Chester was £227 K, whereas median was £180 K
- New Property sales were 15.64% by value, whereas Not New Property contributed 84.36%
Cheshire West and Chester has unitary authority status in North West England.
Total Sales By Property Type
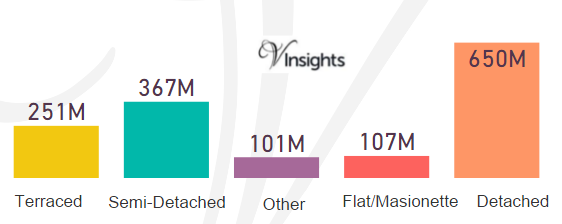
Cheshire West and Chester had total property sales of £1.48 billions which was 6.81% of the North West Property Market 2015.
The split across the different property types are:
- Terraced at £251 millions (17.03%)
- Semi-Detached at £367 millions (24.85%)
- Other at £101 millions (6.82%)
- Flat/Maisonette at £107 millions (7.24%)
- Detached at £650 millions (44.06%)
Total No Of Properties Sold By Property Type
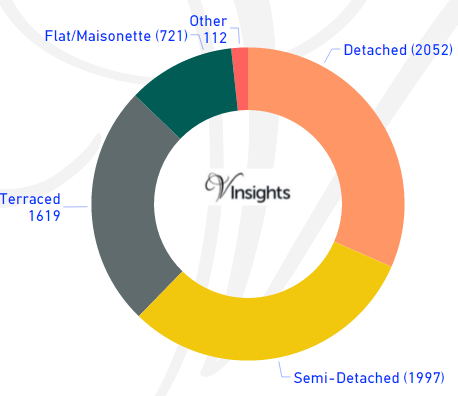
The total property sales of £268 millions in 2015 was spread over 6,501 properties.
- Terraced properties was 1,619 (24.9%)
- Detached at 2052 (31.56%)
- Semi-Detached at 1997 (30.72%)
- Flat/Maisonette at 721 (11.09%)
- Others at 112 (1.72%)
Average & Median Sales Price
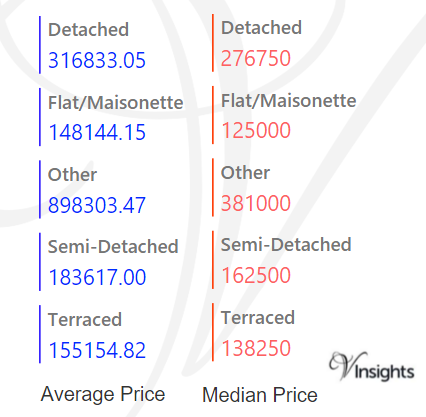
The average sales price in Cheshire West and Chester was £227 K.For the different property types it was:
- Detached at £317 K
- Semi-Detached at £184 K
- Terraced at £155 K
- Flat/Maisonette at £148 K
- Other it is at £898 K
Similarly median sales price in Cheshire West and Chester was £180 K.For different property types it was:
- Detached at £277 K
- Semi-Detached at £163 K
- Terraced at £138 K
- Flat/Maisonette at £125 K
- Other it is at £381 K
New Vs Not New Property Statistics
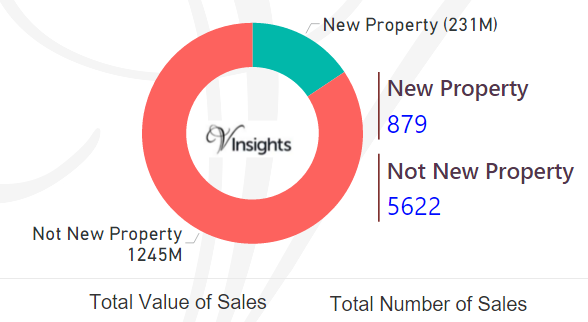
By Sales Values the split is as follows:
- New Property was £231 millions (15.64%)
- Not New Property contributed £1.25 billions (84.36%)
By Total Number the split is as follows:
- New properties sold were 879 (13.52%)
- Not new property sold were 5,622 (86.48%)
All North West England Posts
931062dc-887f-4699-8174-d3b53b31646e|0|.0|27604f05-86ad-47ef-9e05-950bb762570c
For 2016 Details : Cheshire East Property Market 2016 at Postcode Level with School Details
Story Highlights
- Cheshire East had total property sales of £1.98 billions in 2015
- The total number of properties sold in 2015 was 7,805
- The average sales price in Cheshire East was £253 K, whereas median was £190 K
- New Property sales were 10.11% by value, whereas Not New Property contributed 89.89%
Cheshire East has unitary authority status in North West England.
Total Sales By Property Type
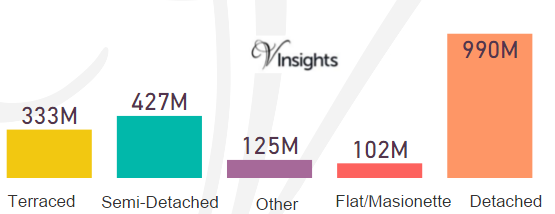
Cheshire East had total property sales of £1.98 billions which was 9.13% of the North West Property Market 2015.
The split across the different property types are:
- Terraced £333 millions (16.85%)
- Semi-Detached £427 millions (21.59%)
- Other £125 millions (6.34%)
- Flat/Maisonette £102 millions (5.16%)
- Detached £990 millions (50.06%).
Total No Of Properties Sold By Property Type
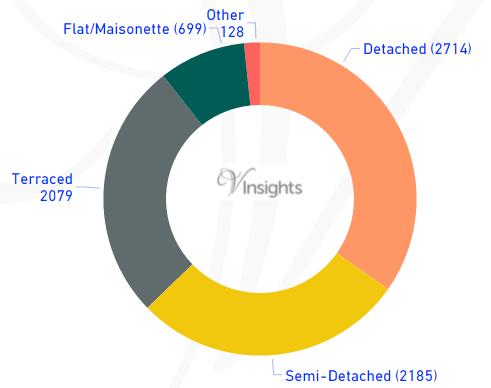
The total property sales of £1.98 billions in 2015 was spread over 7,805 properties.
- Terraced properties 2,079 (26.64%)
- Detached 2,714 (34.47%)
- Semi-Detached 2,185 (%)
- Flat/Maisonette 699 (27.99%)
- Others 128 (1.64%)
Average & Median Sales Price
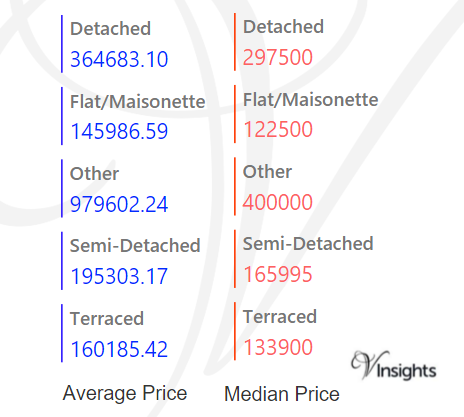
The average sales price in Cheshire East was £253 K. For the different property types it was:
- Detached £365 K
- Semi-Detached £195 K
- Terraced £160 K
- Flat/Maisonette £146 K
- Other it is £980 K
Similarly median sales price in Cheshire East was £190 K. For different property types it was:
- Detached £298 K
- Semi-Detached £166 K
- Terraced £134 K
- Flat/Maisonette £123 K
- Other it is £400 K
New Vs Not New Property Statistics
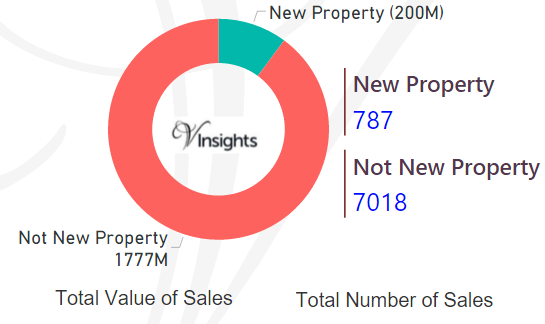
By Sales Values the split is as follows:
- New Property was £200 millions (10.11%)
- Not New Property contributed £1.78 billions (89.89%)
By Total Number the split is as follows:
- New properties sold were 787 (10.08%)
- Not new property sold were 7,018 (89.92%)
All England Posts
34a1149a-d8aa-49a2-b4ea-4797ef784966|0|.0|27604f05-86ad-47ef-9e05-950bb762570c
For 2016 Details : Blackpool Property Market 2016 at Postcode Level with School Details
Story Highlights
- Blackpool had total property sales of £242 millions in 2015
- The total number of properties sold in 2015 was 2,210
- The average sales price in Blackpool was £109 K, whereas median was £100 K
- New Property sales were 3.03% by value, where as Not New Property contributed 96.97%
Blackpool has unitary authority status in North West England.
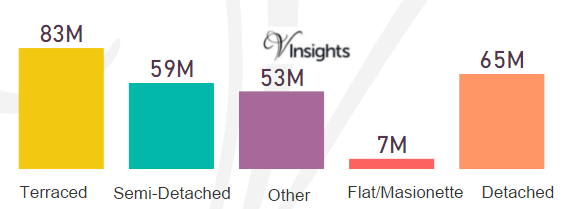
Total Sales By Property Type
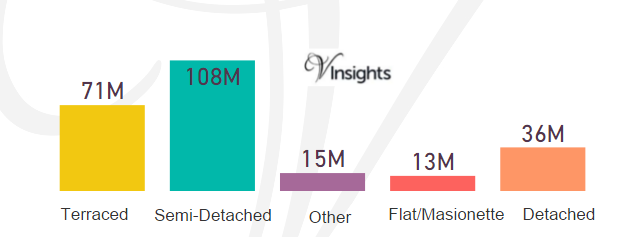
Blackpool had total property sales of £242 millions which was 1.12% of the North West Property Market 2015.
The split across the different property types are:
- Terraced £71 millions (29.26%)
- Semi-Detached £108 millions (44.46%)
- Other £15 millions (6.17%)
- Flat/Maisonette £13 millions (5.22%)
- Detached £36 millions (14.9%).
Total No Of Properties Sold By Property Type
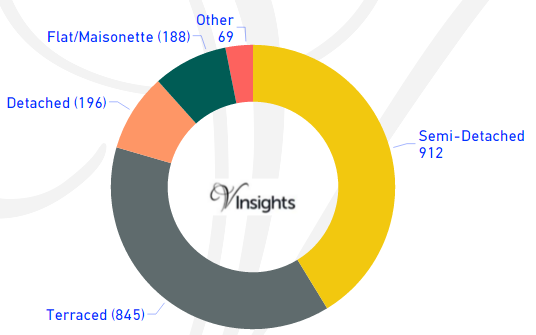
The total property sales of £242 millions in 2015 was spread over 2,210 properties.
- Terraced properties was 845 (38.24%)
- Detached 196 (8.87%)
- Semi-Detached 912 (41.27%)
- Flat/Maisonette 188 (8.51%)
- Others 69 (3.12%)
Average & Median Sales Price
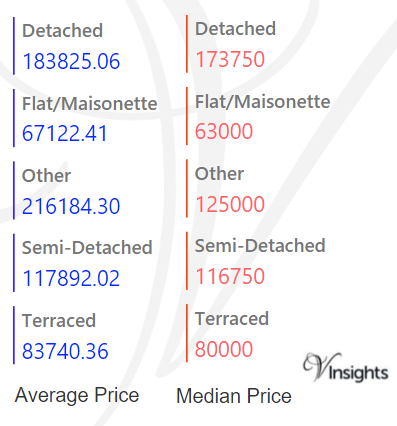
The average sales price in Blackpool was £109 K.For the different property types it was:
- Detached £184 K
- Semi-Detached £118 K
- Terraced £84 K
- Flat/Maisonette £67 K
- Other it is £216 K
Similarly median sales price in Blackpool was £100 K.For different property types are:
- Detached £174 K
- Semi-Detached £117 K
- Terraced £80 K
- Flat/Maisonette £63 K
- Other it is £125 K.
New Vs Not New Property Statistics
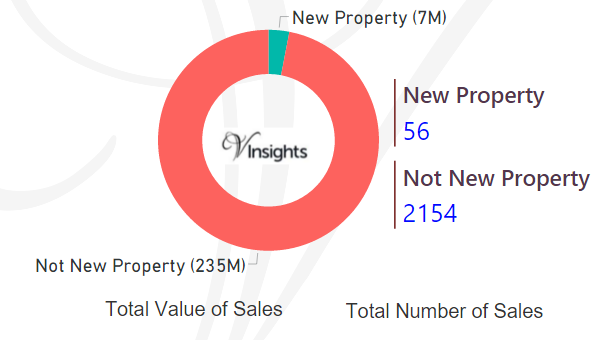
By Sales Values the split is as follows:
- New Property was £7 millions (3.03%)
- Not New Property contributed £235 millions (96.97%)
By Total Number the split is as follows:
- New properties sold were 56 (2.53%)
- Not new property sold were 2,154 (97.47%).
All England Posts
d555c07c-84b8-4883-bda9-f235c820efc4|0|.0|27604f05-86ad-47ef-9e05-950bb762570c
For 2016 Details : Blackburn With Darwen Property Market 2016 at Postcode Level with School Details
Story Highlights
- Blackburn With Darwen had total property sales of £268 millions in 2015
- The total number of properties sold in 2015 was 1,857
- The average sales price in Blackburn With Darwen was £144 K whereas median was £100 K
- New Property sales were 4.9% by value, where as Not New Property contributed 95.1%
Blackburn With Darwen has unitary authority status in North West England.
Total Sales By Property Type
Blackburn With Darwen had total property sales of £268 millions which was 1.24% of the North West Property Market 2015.
The split across the different property types are:
- Terraced at £83 millions (31%)
- Semi-Detached at £59 millions (22.06%)
- Other at £53 millions (19.91%)
- Flat/Maisonette at £7 millions (2.65%)
- Detached at £65 millions (24.37%)
Total No Of Properties Sold By Property Type
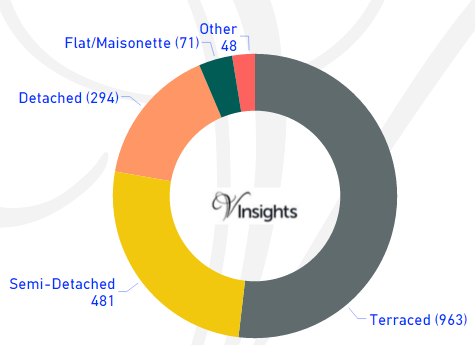
The total property sales of £268 millions in 2015 was spread over 1,857 properties.
- Terraced properties was 963 (51.86%)
- Detached at 294 (%)
- Semi-Detached at 481 (25.9%)
- Flat/Maisonette at 71 (3.82%)
- Others at 48 (2.58%)
Average & Median Sales Price
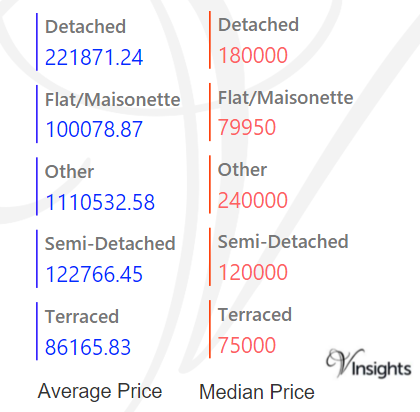
The average sales price in Blackburn With Darwen was £144 K.For the different property types it was:
- Detached at £222 K
- Semi-Detached at £123 K
- Terraced at £86 K
- Flat/Maisonette at £100 K
- Other it is at £1.1 millions
Similarly median sales price in Blackburn With Darwen was £100 K.For different property types are:
- Detached at £180 K
- Semi-Detached at £120 K
- Terraced at £75 K
- Flat/Maisonette at £80 K
- Other it is at £240 K.
New Vs Not New Property Statistics
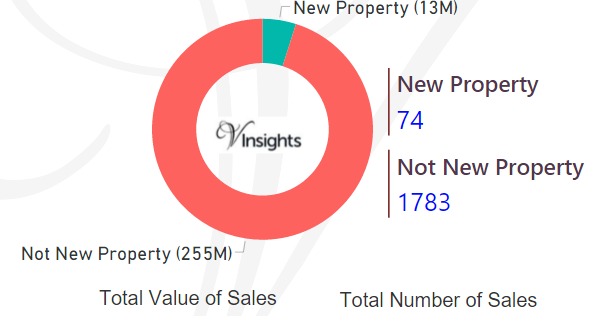
By Sales Values the split is as follows:
- New Property was £13 millions (4.9%)
- Not New Property contributed £255 millions (95.1%)
By Total Number the split is as follows:
- New properties sold were 74 (3.98%)
- Not new property sold were 1,783 (96.02%)
All England Posts
eb3d0e97-ac6b-44f3-bc35-046d8467bc17|0|.0|27604f05-86ad-47ef-9e05-950bb762570c