For 2016 Details : Warrington Property Market 2016 at Postcode Level with School Details
Story Highlights
- Warrington had total property sales of £755 millions in 2015
- The total number of properties sold in 2015 was 3,581
- The average sales price in Warrington was £211 K, whereas median was £162 K
- New Property sales were 12.36% by value ,whereas Not New Property contributed 87.64%
Warrington has unitary authority status in North West England.
Total Sales By Property Type
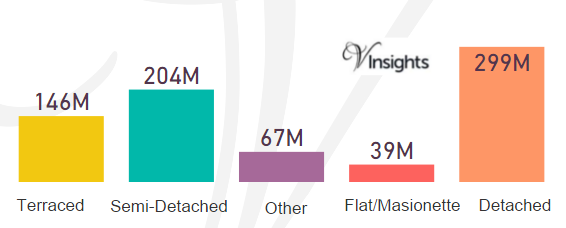
Warrington had total property sales of £755 millions which was 3.49% of the North West Property Market 2015.
The split across the different property types are:
- Terraced £146 millions (19.32%)
- Semi-Detached £204 millions (27.08%)
- Other £67 millions (8.87%)
- Flat/Maisonette £39 millions (5.16%)
- Detached £299 millions (39.57%)
Total No Of Properties Sold By Property Type
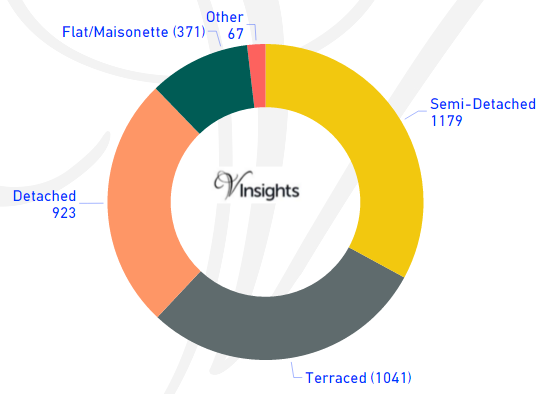
The total property sales of £755 millions in 2015 was spread over 3,581 properties.
- Terraced properties 1,041 (29.07%)
- Detached 923 (25.77%)
- Semi-Detached 1179 (32.92%)
- Flat/Maisonette 371 (10.36%)
- Others 67(1.87%)
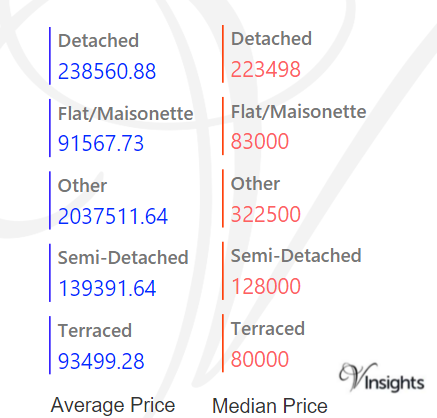
Average & Median Sales Price
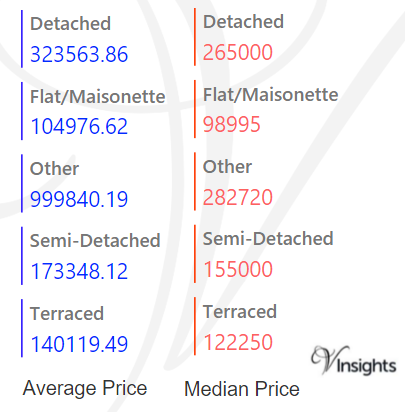
The average sales price in Warrington was £211 K.For the different property types it was:
- Detached £324 K
- Semi-Detached £173 K
- Terraced £140 K
- Flat/Maisonette £105 K
- Other it is £1 million
Similarly median sales price in Warrington was £162 K.For different property types it was:
- Detached £265 K
- Semi-Detached £155 K
- Terraced £122 K
- Flat/Maisonette £99 K
- Other it is £283 K
New Vs Not New Property Statistics
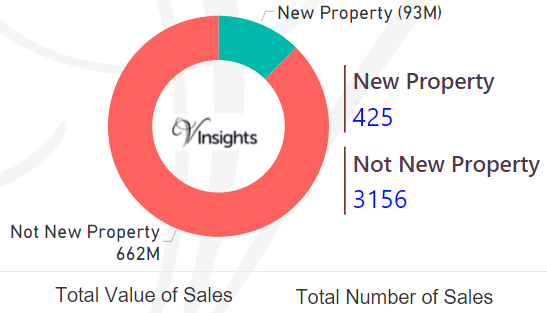
By Sales Values the split is as follows:
- New Property was £93 millions (12.36%)
- Not New Property contributed £662 millions (87.64%)
By Total Number the split is as follows:
- New properties sold were 425 (11.87%)
- Not new property sold were 3,156 (88.13%).
All North West England Posts

68517deb-f6e7-4ed4-988d-94ebe48857e9|0|.0|27604f05-86ad-47ef-9e05-950bb762570c
Story Highlights
- Merseyside had total property sales of £3.35 billions in 2015.
- The total number of properties sold in 2015 in Merseyside was 20,317
- The total volume of sales at district level was maximum for Liverpool at £1.17 billions
- The average sales price in Merseyside was £165 K, whereas median was £130 K
- The average sales price at district level was maximum for Sefton at £173 K
- Similarly the median of sales price at district level was maximum for Sefton at £148 K
- New Property sales in Merseyside contributed 7.99% and Not New Property contributed 92.01%
Merseyside is one of the counties of North West England. The districts in Merseyside are Liverpool, Wirral, Sefton, St Helens, and Knowsley.
Total Sales By Districts
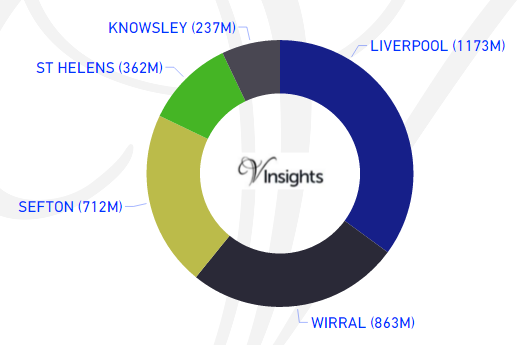
Merseyside had total property sales of £3.35 billions which was 15.45% of the North West Property Market 2015.
The split across its districts is as follow:
- Liverpool at £1.17 billions (35.05%)
- Wirral at £ 863 millions (25.8%)
- Sefton at £712 millions (21.27%)
- St Helens at £362 millions (10.81%)
- Knowsley at £237 millions (7.08%)
Total Sales By Property Type
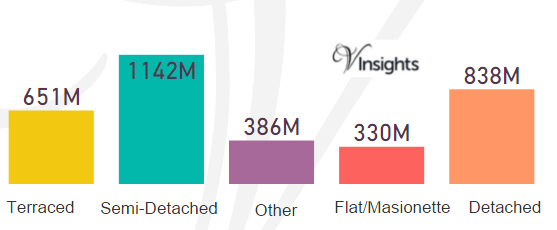
The split of £3.35 billions across the different property types in Merseyside are :
- Detached at £838 millions (25.03%)
- Terraced at £651 millions (19.45%)
- Semi-Detached at £1.14 billions (34.12%)
- Flat/Maisonette at £330 millions (9.88%)
- Other at £386 millions (11.52%)
Total No Of Properties Sold By Property Type
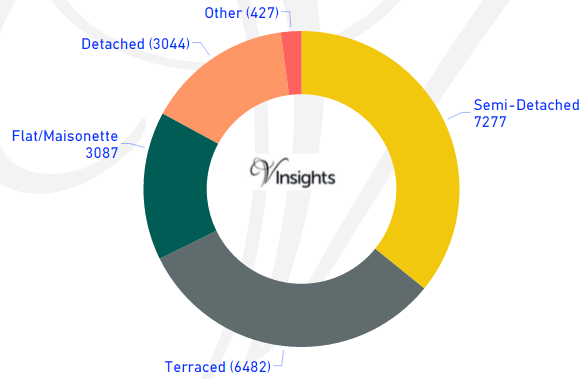
The total property sales of £3.35 billions in 2015 was spread over 20,317 properties.
- Terraced properties at 6,482 (31.9%)
- Detached at 3,044 (14.98%)
- Semi-Detached at 7,277 (35.82%)
- Flat/Maisonette at 3,087 (15.19%)
- Others at 427 (2.1%)
Average & Median Sales Price
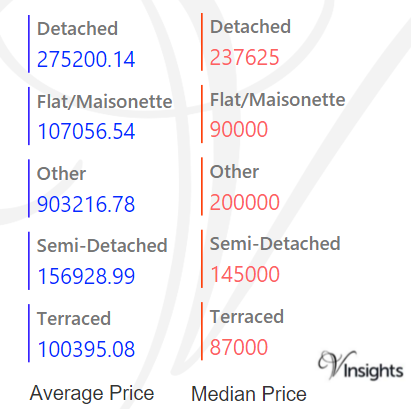
The average sales price in Merseyside was £165 K.For the different property types it was:
- Detached at £275 K
- Semi-Detached at £157 K
- Terraced at £100 K
- Flat/Maisonette at £107 K
- Other at £903 K
Similarly median sales price in Merseyside was £130 K.For different property types it was:
- Detached at £238 K
- Semi-Detached at £145 K
- Terraced at £87 K
- Flat/Maisonette at £90 K
- Other at £200 K
Average & Median Sales Price By Districts
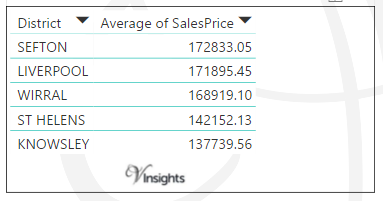
The average sales price in 2015 at district level in Merseyside is as above:
- It was maximum for Sefton at £173 K
- Liverpool at £172 K
- Wirral at £169 K
- St Helens at £142 K
- with minimum for Knowsley at £138 K
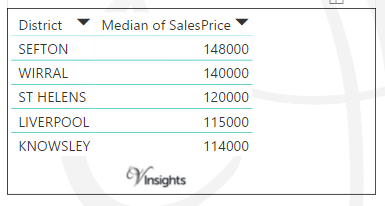
The median sales price in 2015 at district level in Merseyside is as above:
- It was maximum for Sefton at £148 K
- Wirral at £140 K
- St Helens at £120 K
- Liverpool at £ 115 K
- with minimum for Knowsley at £114 K
New Vs Not New Property Statistics
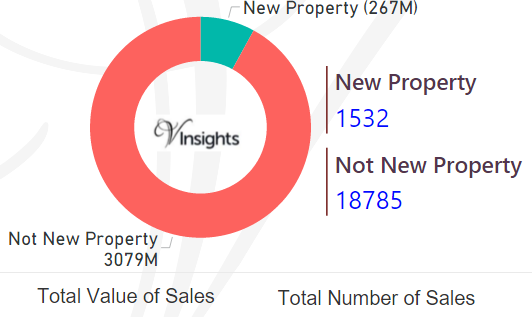
By Sales Values the split is as follows:
- New Properties contributed £267 millions (7.99%)
- Not New Property contributed £3.08 billions (92.01%)
By Total Number the split is as follows:
- New properties sold were 1,532 (7.54%)
- Not new property sold were 18,785 (92.46%)
All Merseyside Posts
4fd98893-1192-411a-b363-9e4ec3a5ff42|0|.0|27604f05-86ad-47ef-9e05-950bb762570c
Story Highlights
- Lancashire had total property sales of £3.44 billions in 2015.
- The total number of properties sold in 2015 in Lancashire was 20,650
- The total volume of sales at district level was maximum for Lancaster at £437 millions
- The average sales price in Lancashire was £167 K, whereas median was £138 K
- The average sales price at district level was maximum for Ribble Valley at £251 K
- Similarly the median of sales price at district level was maximum for Ribble Valley at £195 K
- New Property sales in Lancashire contributed 12.29% and Not New Property contributed 87.71%
Lancashire is one of the counties of North West England. The districts in Lancashire are Lancaster, Chorley, South Ribble, Fylde, Preston, Wyre, West Lancashire, Ribble Valley, Pendle, Rossendale, Burnley and Hyndburn.
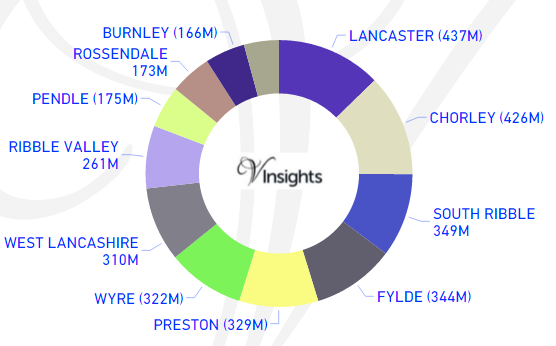
Total Sales By Districts
 Greater Manchester had total property sales of £3.44 billions which was 15.88% of the North West Property Market 2015.
The split across its districts is as follow:
- Lancaster at £437 millions (12.7%)
- Chorley at £426 millions (12.38%)
- South Ribble at £349 millions (10.15%)
- Fylde at £344 millions (10.01%)
- Preston at £329 (9,58%)
- Wyre at £322 millions (9.37%)
- West Lancashire at £310 millions (9.01%)
- Ribble Valley at £261 millions (7.6%)
- Pendle at £175 millions (5.1%)
- Rossendale at £173 millions (5.03%)
- Burnley at £166 millions (4.83%)
- Hyndburn at £146 millions (4.23%)
Total Sales By Property Type
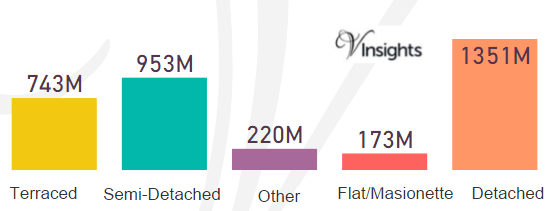
The split of £3.44 billions across the different property types in Lancashire are :
- Detached at £1.35 billions (39.28%)
- Terraced at £743 millions (21.6%)
- Semi-Detached at £953 millions (27.7%)
- Flat/Maisonette at £173 millions (5.02%)
- Other at £220 millions (6.4%)
Total No Of Properties Sold By Property Type
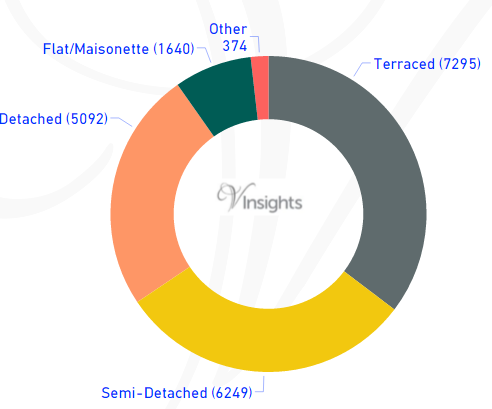
The total property sales of £3.44 billions in 2015 was spread over 20,650 properties.
- Terraced properties at 7,295 (35.33%)
- Detached at 5,092 (24.66%)
- Semi-Detached at 6,249 (30,26%)
- Flat/Maisonette at 1,640 (7.94%)
- Others at 374 (1.81%)
Average & Median Sales Price
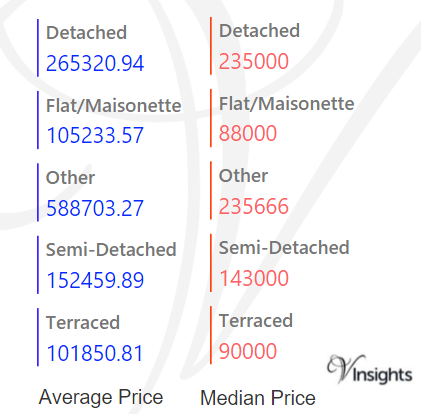
The average sales price in Lancashire was £167 K. For the different property types it was:
- Detached at £265 K
- Semi-Detached at £153 K
- Terraced at £102 K
- Flat/Maisonette at £105 K
- Other at £589 K
Similarly median sales price in Lancashire was £138 K. For different property types it was:
- Detached at £235 K
- Semi-Detached at £143 K
- Terraced at £90 K
- Flat/Maisonette at £88 K
- Other at £236 K
Average & Median Sales Price By Districts
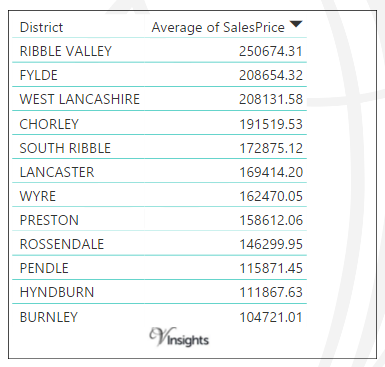
The average sales prices at district level in Lancashire for 2015 is as follows:
- Ribble Valley at £251 K
- Fylde at £209 K
- West Lancashire at £208 K
- Chorley at £192 K
- South Ribble at £173 K
- Lancaster at £169 K
- Wyre at £163 K
- Preston at £159 K
- Rossendale at £146 K
- Pendle at £116 K
- Hyndburn at £112
- Burnley at £105 K
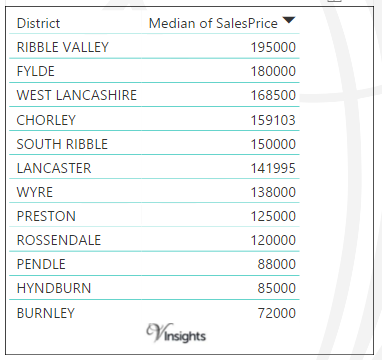
The median sales prices at district level in Lancashire for 2015 is as follows:
- Ribble Valley at £195 K
- Fylde at £180 K
- West Lancashire at £169 K
- Chorley at £159 K
- South Ribble at £150 K
- Lancaster at £142 K
- Wyre at £138 K
- Preston at £125 K
- Rossendale at £120 K
- Pendle at £88 K
- Hyndburn at £85 K
- Burnley at £72 K
New Vs Not New Property Statistics
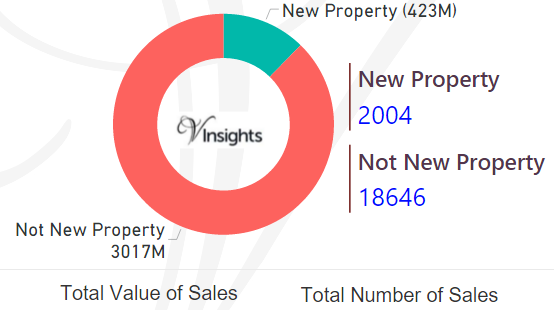
By Total Values Of Sales
- Not New Properties contributed £3.02 billions (87.71%)
- New Property contributed £423 millions (12.29%)
By Total Number Of Sales
- New properties sold were 2004 (9.7%)
- Not new property sold were 18646 (90.3%)
All Lancashire Posts
5d94dd52-8475-48db-8ee1-d93b32ce3c6d|0|.0|27604f05-86ad-47ef-9e05-950bb762570c
Story Highlights
- Halton had total property sales of £363 millions in 2015
- The total number of properties sold in 2015 was 1,744
- The average sales price in Halton was £208 K, whereas median was £125 K
- New Property sales were 10.67% by value, whereas Not New Property contributed 89.33%
Halton has unitary authority status in North West England.
Total Sales By Property Type
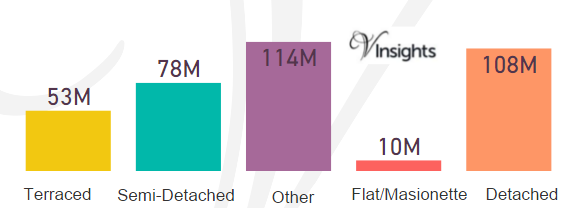 Halton had total property sales of £363 millions which was 1.68% of the of the North West Property Market 2015.
The split across the different property types are:
- Terraced £53 millions (14.7%)
- Semi-Detached £78 millions (21.45%)
- Other £114 millions (31.41%)
- Flat/Maisonette £10 millions (2.62%)
- Detached £108 millions (29.82%)
Total No Of Properties Sold By Property Type
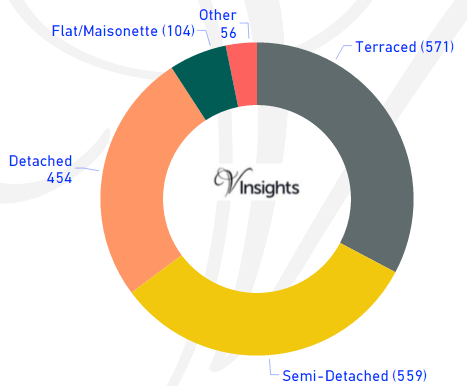
The total property sales of £363 millions in 2015 was spread over 1,744 properties.
- Terraced properties was 571 (32.74%)
- Detached 454 (26.03%)
- Semi-Detached 559 (32.05%)
- Flat/Maisonette 104 (5.96%)
- Others 56 (3.21%)
Average & Median Sales Price
The average sales price in Halton was £208 K. For the different property types it was:
- Detached £239 K
- Semi-Detached £139 K
- Terraced £94 K
- Flat/Maisonette £92 K
- Other it is £2.04 millions
Similarly median sales price in Halton was £125 K. For different property types it was:
- Detached £223 K
- Semi-Detached £128 K
- Terraced £80 K
- Flat/Maisonette £83 K
- Other it is £323 K
New Vs Not New Property Statistics
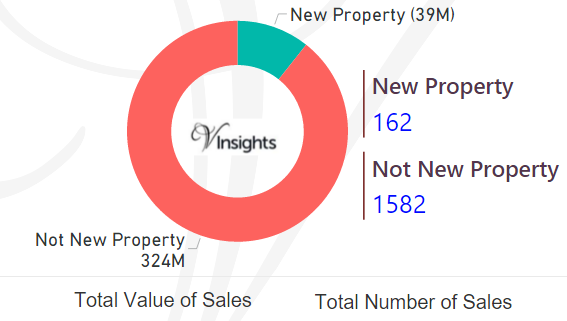
By Sales Values the split is as follows:
- New Property was £39 millions (10.67%)
- Not New Property contributed £324 millions (89.33%)
By Total Number the split is as follows:
- New properties sold were 162 (9.29%)
- Not new property sold were 1,582 (90.71%)
All North West England Posts
d146aa1d-fbef-47a1-a658-7c796ca0f959|0|.0|27604f05-86ad-47ef-9e05-950bb762570c
Story Highlights
- Greater Manchester had total property sales of £8.12 billions in 2015.
- The total number of properties sold in 2015 in Greater Manchester was 43,818
- The total volume of sales at district level was maximum for Manchester at £1.84 billions
- The average sales price in Greater Manchester was £185 K, whereas median was £137 K
- The average sales price at district level was maximum for Trafford at £285 K
- Similarly the median of sales price at district level was maximum for Trafford at £220 K
- New Property sales in Greater Manchester contributed 8.74% and Not New Property contributed 91.26%
Greater Manchester is one of the counties of North West England. The districts in Greater Manchester are Manchester, Trafford, Stockport, Salford, Wigan, Bolton, Bury, Tameside, Rochdale and Oldham.
Total Sales By Districts
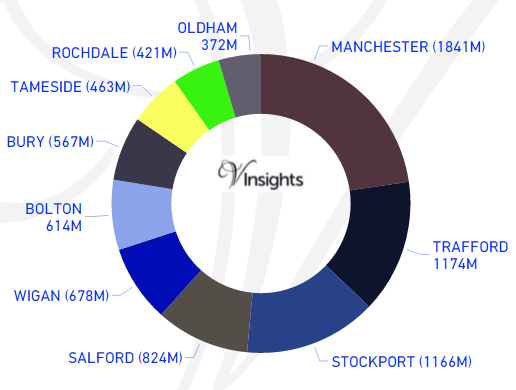
Greater Manchester had total property sales of £8.12 billions which was 37.49% of the North West Property Market 2015.
The split across its districts is as follow:
- Manchester at £1.84 billions (22.67%)
- Trafford at £1.174 billions (14.45%)
- Stockport at £1.16 billions (14.36%)
- Salford at £824 millions (10.14%)
- Wigan at £678 millions (8.35%)
- Bolton at £614 millions (7.56%)
- Bury at £567 millions (6.98%)
- Tameside at £463 millions (5.7%)
- Rochdale at £421 millions (5.19%)
- Oldham at £372 millions (4.59%)
Total Sales By Property Type
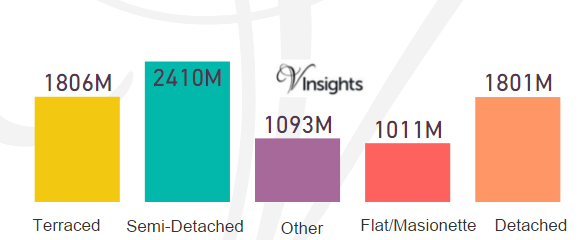
The split of £8.12 billions across the different property types in Greater Manchester are :
- Detached at £1.8 billions (22.18%)
- Terraced at £1.81 billions (22.24%)
- Semi-Detached at £2.4 billions (29.67%)
- Flat/Maisonette at £1.01 billions (12.45%)
- Other at £1.09 billions (13.46%)
Total No Of Properties Sold By Property Type
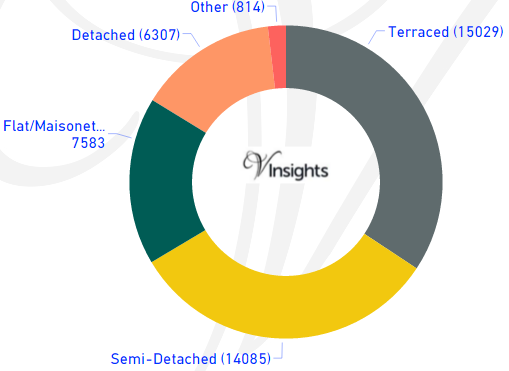
The total property sales of £8.12 billions in 2015 was spread over 43,818 properties.
- Terraced properties at 15,029 (34.3%)
- Detached at 6,307(14.39%)
- Semi-Detached at 14,085 (32.14%)
- Flat/Maisonette at 7,583(17.31%)
- Others at 814 (1.86%)
Average & Median Sales Price
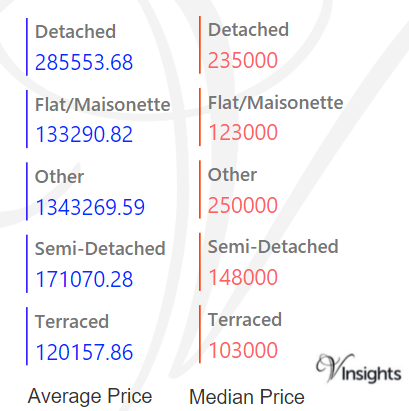
The average sales price in Greater Manchester was £185 K.For the different property types it was:
- Detached at £286 K
- Semi-Detached at £171 K
- Terraced at £120 K
- Flat/Maisonette at £133 K
- Other at £1.34 millions
Similarly median sales price in Greater Manchester was £137 K.For different property types are:
- Detached at £235 K
- Semi-Detached at £148 K
- Terraced at £103 K
- Flat/Maisonette at £123 K
- Other at £250 K
Average & Median Sales Price By Districts
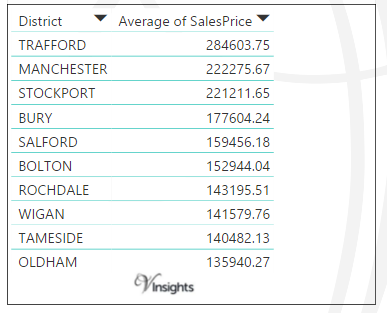
The average sales prices at district level in Greater Manchester for 2015 is as follows:
- Trafford was maximum at £285 K
- Manchester at £222 K
- Stockport at £221 K
- Bury at £178
- Salford at £159
- Bolton at £153
- Rochdale at £143
- Wigan at £142
- Tameside at £141
- Oldham at £136
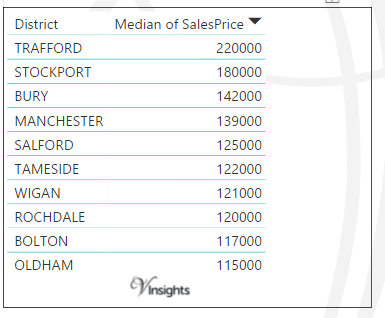
The average sales prices at district level in Greater Manchester for 2015 is as follows:
- Trafford was maximum at £220 K
- Stockport at £180 K
- Bury at £142 K
- Manchester at £139 K
- Salford at £125 K
- Tameside at £122 K
- Wigan at £121 K
- Rochdale at £120 K
- Bolton at £117 K
- with minimum for Oldham at £115 K
New Vs Not New Property Statistics
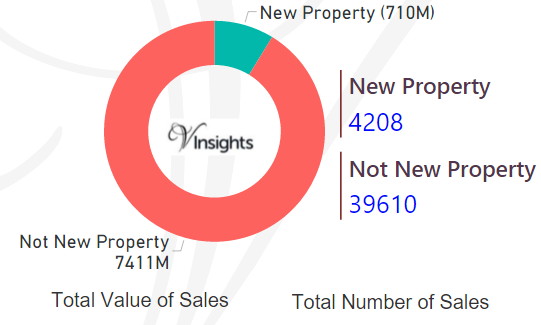
By Sales Values the split is as follows:
- New Properties contributed £710 millions (8.74%)
- Not New Property contributed £7.4 billions (91.26%)
By Total Number the split is as follows:
- New properties sold were 4,208 (9.6%)
- Not new property sold were 39,610 (90.4%).
All Great Manchester Posts
55b0764a-6d44-40a7-af42-1c9caaa3efc5|0|.0|27604f05-86ad-47ef-9e05-950bb762570c