
Story Highlights
- West Midlands had total property sales of £20 Billions in 2016
- The number of properties sold was 90,174 properties
- The average property price was £220 K and the median was £166 K
- The average sales price at the county level was maximum at Warwickshire £295 K
- New properties contributed 8.94% by sales value and not new 91.06%
- Stamp duty hike caused monthly spike in March
- Brexit did not have impact and in 2016 West Midlands region witnessed growth of 5.26% year on year
West Midlands is one of the 9 principal areas of England. It comprises of Herefordshire, Shropshire, Telford and Wrekin, Staffordshire, Stoke-on-Trent,Warwickshire, West Midlands (county), Worcestershire, Warwickshire
Total Sales By County
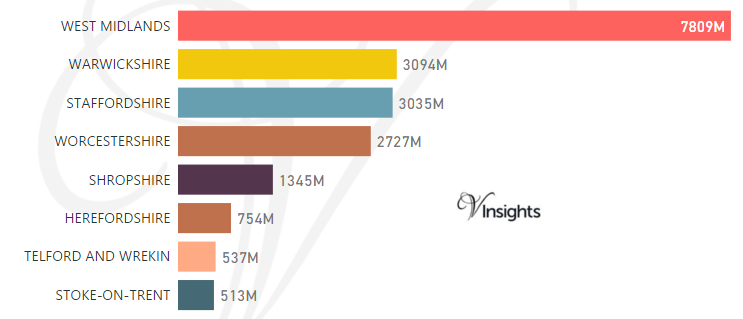
West Midlands region had total property sales of £20 billions. It contributed 6.67% of the England and Wales Property Market 2016.
The split of £20 billions across its counties was
Year on Year Comparison : Compared to West Midlands Property Market 2015 in 2016
- All the counties have shown growth in property sales.
- Year on Year growth in total property sales by value was 5.26%
Total Value of Sales By Property Types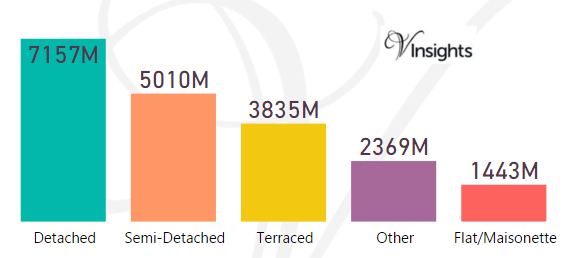
The split of £20 billions across the different property types was
- Detached at £7.16 billions (36.12%),
- Semi-Detached at £5.01 billions (25.29%),
- Terraced at £3.84 billions (19.35%) ,
- Other at £2.37 billions (11.96%),
- Flat/Maisonette at £1.44 Billions (7.28%)
Year on Year Comparison : Compared to West Midlands Property Market 2015 in 2016
- All the property types sales have shown growth in sales value
- It indicates growth year on year
Month-wise Break-up of Total Sales
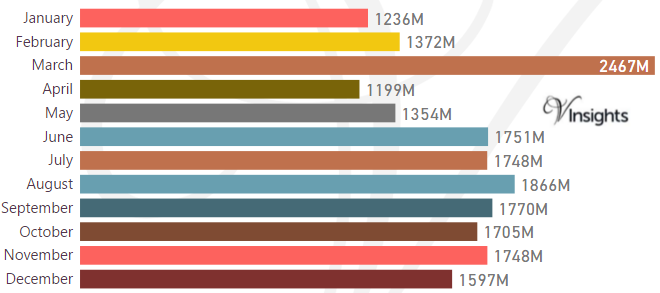
Some of the insights based on the £20 billions month-wise break-down :
Stamp Duty Hike Impact
- March had property sale spike of £2.5 billions compared to £1.37 billions in Feb
- The impetus for it was to avoid the extra 3% in Stamp Duty Tax applicable on buying an additional home, being applicable from April 1 2016
Brexit Impact
- Brexit took place on 23rd June 2016.
- As can be observed from the month-wise break-up there does not seem to have been dip in property sales in the immediate aftermath of Brexit
- Brexit did not have an impact as year on year there was growth of 5.26% in total property sales by value
Total Number of Sales By Property Types
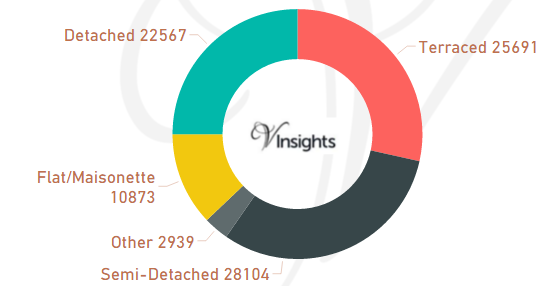
The total property sales of £20 billions in 2016 was spread over 90,174 properties.
- Semi-Detached at 28,104 (31.17%)
- Terraced at 25,691 (28.49%)
- Detached at 22,567 (25.03%)
- Flat/Maisonette at 10,873 (12.06%)
- Others at 2,939 (3.26%)
Year on Year Comparison : Compared to West Midlands Property Market 2015 in 2016
- Total number of property sales in 2016 has increased by 1.40%.
- All property types have shown growth in number of properties sold except property type Terraced, Detached.
- Property Type Other has shown significant growth of 68.5%
Average & Median Sales Price
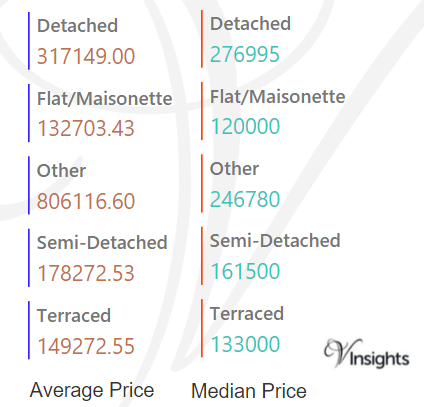
The average sales price in West Midlands was £220 K. For the different property types it was
- Detached £317 K
- Semi-Detached £178 K
- Terraced £149 K
- Flat/Maisonette £133 K
- Other it is £806 K
The median sales price in West Midlands was £166 K. For the different property types it was
- Detached £277 at K
- Semi-Detached at £162 K
- Terraced at £133 K
- Flat/Maisonette at £120 K
- Other it is at £247 K
Year on Year Comparison : Compared to West Midlands Property Market 2015 in 2016
- The average and median property prices have gone up except for property type Other
Average & Median Sales Price By County
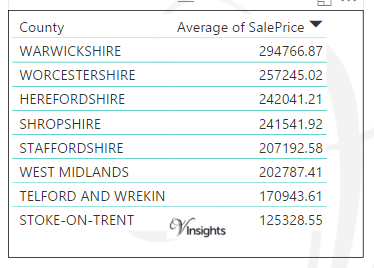
The average sales price at the county level in West Midlands 2016 is as above.
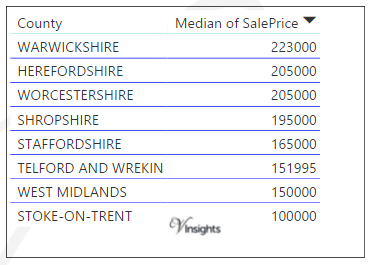
The median sales price at the county level in West Midlands 2016 is as above.
Year on Year Comparison : Compared to West Midlands Property Market 2015 in 2016
- The average and median sales price across all the counties have gone up except for Herefordshire, Stoke-On-Trent
- The median sales price across all the counties have gone up
New Vs Not New Property Statistics
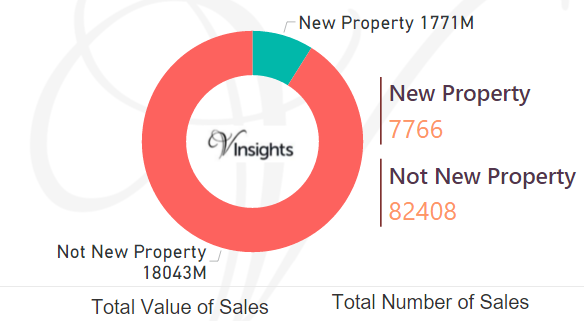
By Value Of Sales
- The sales value contributed by New Property was £1.77 billions (8.94%)
- where as Not New Property contributed £18.04 billions (91.06%)
By Number Of Sales
- New properties sold were 7,766 (8.61%)
- where as not new property sold were 82,408 (91.39%).
Year on Year Comparison : Compared to West Midlands Property Market 2015 in 2016
- New property market share in property market has gone down in 2016 over 2015
All England Posts

e9a3ee70-7f59-4bc2-96b8-21ae3008da1b|0|.0|27604f05-86ad-47ef-9e05-950bb762570c