4. March 2018 19:37
/
VInsights Team
/
/
Comments (0)
Please click here for the updated version of this post
This Post covers
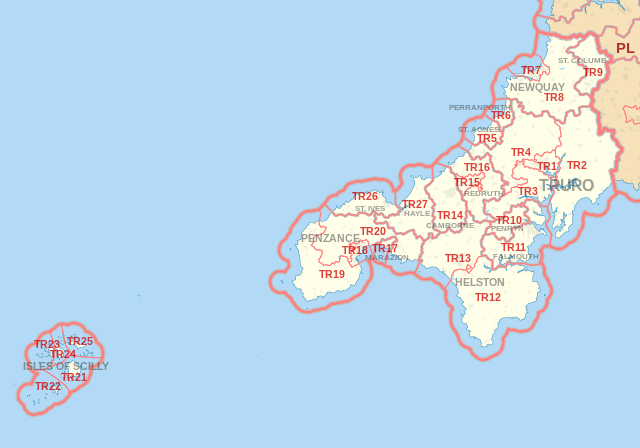 |
| Postcode |
Coverage Area |
Local Authority Area |
| TR10 |
Penryn |
Cornwall |
| TR11 |
Falmouth, Flushing, Mylor Bridge, Constantine, Mawnan Smith |
Cornwall |
| TR12 |
Helston, Mullion |
Cornwall |
| TR13 |
Helston |
Cornwall |
| TR14 |
Camborne |
Cornwall |
| TR15 |
Redruth, Pool |
Cornwall |
| TR16 |
Lanner, Carharrack, Gwennap, St Day, Portreath |
Cornwall |
| TR17 |
Marazion |
Cornwall |
| TR18 |
Penzance |
Cornwall |
| TR19 |
Pendeen, St Buryan |
Cornwall |

- M represents Million Pounds
- Total value includes Property Type Other apart from Detached, Semi-Detached, Terraced, Flat/Masionette
- TR Postcode Area - TR1, TR2, TR3, TR4, TR5, TR6, TR7, TR8, TR9 School Details
- TR Postcode Area - TR10, TR11, TR12, TR13, TR14, TR15, TR16, TR17, TR18, TR19 School Details
- TR Postcode Area - TR20, TR21, TR22, TR23, TR24, TR25, TR26, TR27 School Details
- TR Postcode Area - TR1, TR2, TR3, TR4, TR5, TR6, TR7, TR8, TR9 Property Market 2017
- TR Postcode Area - TR20, TR21, TR22, TR23, TR24, TR25, TR26, TR27 Property Market 2017
- All TR Postcodes Yearly & Trend Analysis Posts
All TR Postcodes Yearly & Trend Analysis Posts

Reference
TR Postcode Area As Per Wikipedia
f3bce6b9-1c11-4007-badf-176dac66d12d|0|.0|27604f05-86ad-47ef-9e05-950bb762570c
Tags :