RM Postcode Area - RM1, RM2, RM3, RM4, RM5, RM6, RM7, RM8, RM9 Property Market 2017

Please click here for the updated version of this post

This Post covers 


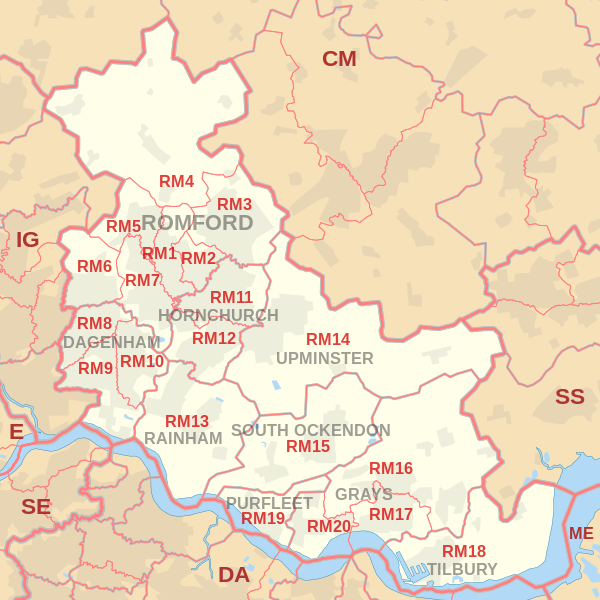
Coverage Area of Postcode RM1 to RM9

Postcode                 Coverage Area          Local Authority Area
RM1 Romford, Rise Park Havering
RM2 Gidea Park, Heath Park Havering
RM3 Harold Wood, Harold Hill, Noak Hill, Harold Park Havering
RM4 Havering-atte-Bower, Abridge, Stapleford Abbotts, Noak Hill, Navestock, Stapleford Tawney, Stapleford Aerodrome Havering, Epping Forest, Brentwood
RM5 Collier Row Havering, Redbridge
RM6 Chadwell Heath, Marks Gate, Little Heath, Goodmayes (north), Hainault (South) Barking and Dagenham, Redbridge, Havering
RM7 Rush Green, Mawneys, Romford Havering, Barking and Dagenham
RM8 Dagenham, Becontree, Becontree Heath, Chadwell Heath Barking and Dagenham, Redbridge
RM9 Dagenham, Becontree Castle Green Barking and Dagenham, Redbridge, Havering


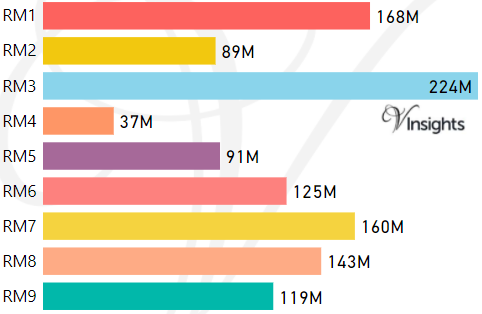
  • M represents Million Pounds
  • Total value includes Property Type Other apart from Detached, Semi-Detached, Terraced, Flat/Masionette


Postcode Detached Semi-Detached Terraced Flat
RM1 £583K £416K £385K £246K
RM2 £717K £491K £437K £273K
RM3 £493K £368K £328K £282K
RM4 £688K £455K £413K £222K
RM5 £424K £364K £347K £237K
RM6 £466K £406K £376K £205K
RM7 £450K £368K £361K £224K
RM8 £435K £320K £317K £238K
RM9 £325K £352K £299K £199K


Postcode Detached Semi-Detached Terraced Flat
RM1 £560K £420K £365K £250K
RM2 £710K £494K £430K £280K
RM3 £460K £350K £315K £271K
RM4 £675K £460K £370K £223K
RM5 £418K £360K £346K £248K
RM6 £455K £397K £373K £212K
RM7 £420K £365K £348K £235K
RM8 £385K £318K £310K £245K
RM9 £325K £340K £300K £200K


Postcode Detached SemiDetached Terraced Flat
RM1 £147K £86K £76K £171K
RM2 £225K £112K £99K £61K
RM3 £123K £70K £82K £90K
RM4 £191K £100K £93K £73K
RM5 £83K £52K £47K £31K
RM6 £79K £76K £81K £54K
RM7 £105K £46K £197K £52K
RM8 £71K £39K £51K £49K
RM9   £63K £35K £35K
For example
  • Say the average detached property price for postcode XYZ is £300 K and ST. DEV. is £30 K.
  • It means that most detached properties in postcode XYZ (about 68%) has price within one ST. Dev. i.e. the price range is  £270K - £330K.
  • All-most all detached property price (95%) in postcode XYZ lie between two ST. Dev.  i.e. £240 K - £360 K


Postcode Detached Semi-Detached Terraced Flat
RM1 27 97 60 207
RM2 25 63 39 66
RM3 31 135 225 191
RM4 18 15 8 5
RM5 13 108 102 29
RM6 8 67 180 102
RM7 19 105 206 123
RM8 2 43 331 67
RM9 1 30 299 38


The Table below gives in percentage, the total number of properties purchased as Buy-To-Let:
Postcode Detached Semi-Detached Terraced Flat
RM1 15% 4% 8% 24%
RM2 8% 0% 5% 17%
RM3 10% 4% 5% 2%
RM4 6% 13% 0% 20%
RM5 8% 6% 4% 21%
RM6 13% 12% 18% 20%
RM7 21% 6% 7% 25%
RM8 50% 21% 17% 7%
RM9 0% 10% 24% 16%
*Buy-to-let consists of Buy-to-lets (where they can be identified by a Mortgage) ,transfers to non-private individuals,  transfers under a power of sale/repossessions


Schools for Postcode Area RM


Property Posts for Postcode Area RM


All RM Postcodes Yearly & Trend Analysis Posts

Reference

RM Postcode Area As Per Wikipedia


Comments are closed