4. March 2018 09:06
/
VInsights Team
/
/
Comments (0)
Please click here for the updated version of this post
This Post covers
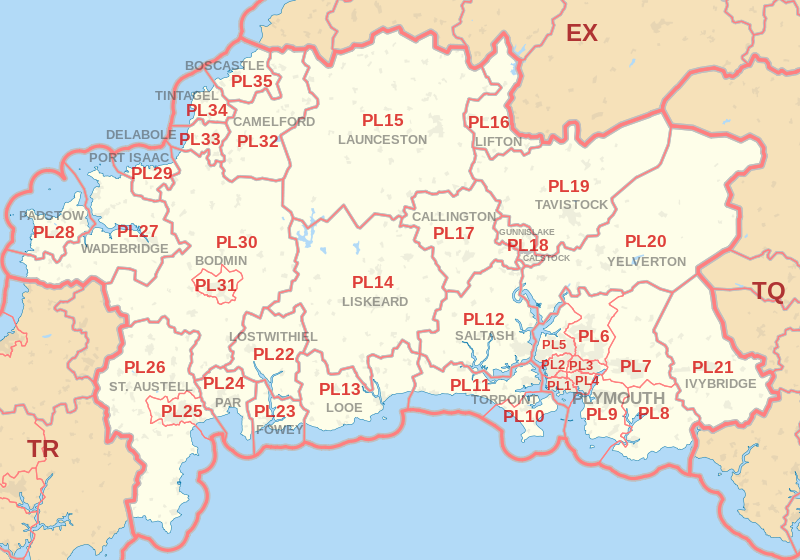 |
| Postcode |
Coverage Area |
Local Authority Area |
| PL1 |
Plymouth, Devonport, The Hoe,
Millbridge, Stoke, Stonehouse |
Plymouth |
| PL2 |
Beacon Park, Ford, Keyham,
North Prospect, Pennycross, Home Park |
Plymouth |
| PL3 |
Efford, Hartley, Laira, Mannamead,
Milehouse, Peverell, Higher Compton |
Plymouth |
| PL4 |
Barbican, Lipson, Mount Gould,
Mutley, Prince Rock, St. Judes |
Plymouth |
| PL5 |
Crownhill, Ernesettle, Honicknowle,
Whitleigh, St. Budeaux, Tamerton Foliot |
Plymouth |
| PL6 |
Derriford, Eggbuckland, Estover,
Leigham, Roborough, Southway
Lopwell, Woolwell, Bickleigh |
Plymouth,
South Hams |
| PL7 |
Plympton, Sparkwell |
Plymouth |
| PL8 |
Brixton, Newton Ferrers, Noss Mayo, Yealmpton |
South Hams |
| PL9 |
Plymstock, Heybrook Bay, Mount Batten, Wembury |
Plymouth |
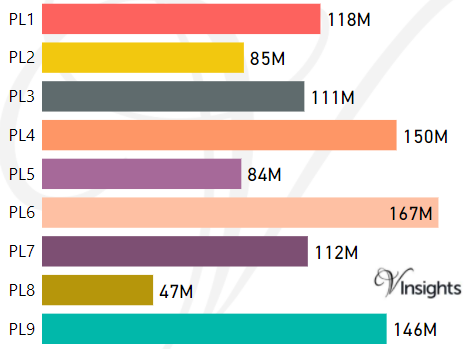
- M represents Million Pounds
- Total value includes Property Type Other apart from Detached, Semi-Detached, Terraced, Flat/Masionette
- PL Postcode Area Property Market - PL1, PL2, PL3, PL4, PL5, PL6, PL7, PL8, PL9 School Details
- PL Postcode Area Property Market - PL10, PL11, PL12, PL13, PL14, PL15, PL16, PL17, PL18, PL19 School Details
- PL Postcode Area Property Market - PL20, PL21, PL22, PL23, PL24, PL25, PL26, PL27, PL28, PL29 School Details
- PL Postcode Area Property Market - PL30, PL31, PL32, PL33, PL34, PL35 School Details
- PL Postcode Area Property Market - PL10, PL11, PL12, PL13, PL14, PL15, PL16, PL17, PL18, PL19 Property Market 2017
- PL Postcode Area Property Market - PL20, PL21, PL22, PL23, PL24, PL25, PL26, PL27, PL28, PL29 Property Market 2017
- PL Postcode Area Property Market - PL30, PL31, PL32, PL33, PL34, PL35 Property Market 2017
All PL Postcodes Yearly & Trend Analysis Posts

Reference
PL Postcode Area As Per Wikipedia
063e70f3-12ee-4891-9a24-bbe590dc7637|0|.0|27604f05-86ad-47ef-9e05-950bb762570c
Tags :