London N Postcode Area - N10, N11, N12, N13, N14, N15, N16, N17, N18, N19 Property Market 2017

Please click here for the updated version of this post

This Post covers 


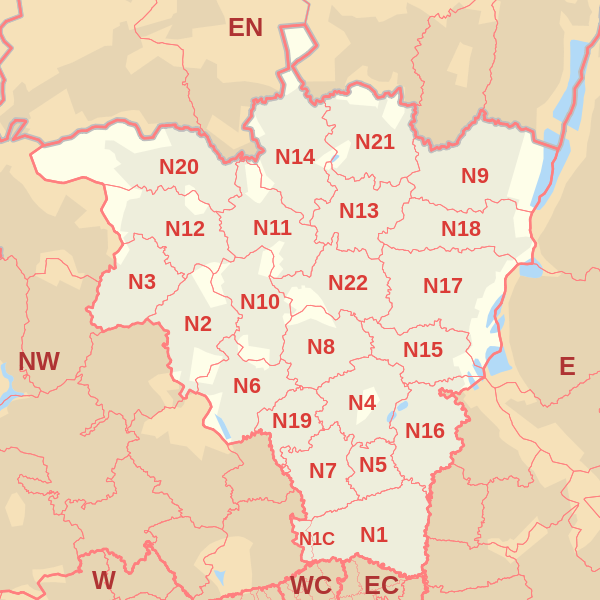
Coverage Area of Postcode N10 to N19

 
Postcode                 Coverage Area          Local Authority Area
N10 Muswell Hill Haringey, Barnet
N11 New Southgate, Friern Barnet, Bounds Green, Arnos Grove (part) Enfield, Barnet, Haringey
N12 North Finchley, Woodside Park Barnet
N13 Palmers Green Enfield, Haringey
N14 Southgate, Oakwood, Arnos Grove (part) Enfield, Barnet
N15 South Tottenham, Harringay (part), West Green, Seven Sisters, Stamford Hill (part) Hackney, Haringey
N16 Stoke Newington, Stamford Hill (part), Shacklewell, Dalston (part), Newington Green (part) Islington, Hackney, Harrow
N17 Tottenham, Wood Green (part) Haringey
N18 Upper Edmonton, Edmonton (part) Enfield,Haringey
N19 Upper Holloway, Archway, Tufnell Park (part) Islington, Camden


  • M represents Million Pounds
  • Total value includes Property Type Other apart from Detached, Semi-Detached, Terraced, Flat/Masionette


Postcode Detached Semi-Detached Terraced Flat
N10 £1569K £1129K £1213K £545K
N11 £676K £706K £562K £364K
N12 £1064K £779K £652K £394K
N13 £713K £774K £621K £340K
N14 £935K £769K £606K £365K
N15   £613K £619K £353K
N16 £1268K £1245K £1073K £484K
N17   £534K £486K £296K
N18 £340K £384K £366K £210K
N19 £960K £1599K £1147K £492K


Postcode Detached Semi-Detached Terraced Flat
N10 £1700K £1100K £1160K £480K
N11 £675K £658K £557K £327K
N12 £1070K £780K £633K £370K
N13 £750K £730K £580K £329K
N14 £880K £737K £550K £375K
N15   £593K £600K £365K
N16 £1330K £1060K £1100K £460K
N17   £445K £480K £300K
N18 £340K £400K £360K £203K
N19 £960K £1525K £1100K £465K


Postcode Detached SemiDetached Terraced Flat
N10 £480K £435K £587K £248K
N11 £162K £214K £174K £136K
N12 £255K £177K £146K £156K
N13 £100K £321K £152K £105K
N14 £271K £159K £160K £87K
N15   £110K £154K £91K
N16 £342K £554K £314K £188K
N17   £289K £113K £86K
N18   £45K £54K £59K
N19   £418K £385K £171K
For example
  • Say the average detached property price for postcode XYZ is £300 K and ST. DEV. is £30 K.
  • It means that most detached properties in postcode XYZ (about 68%) has price within one ST. Dev. i.e. the price range is  £270K - £330K.
  • All-most all detached property price (95%) in postcode XYZ lie between two ST. Dev.  i.e. £240 K - £360 K


Postcode Detached Semi-Detached Terraced Flat
N10 9 30 73 221
N11 5 46 89 112
N12 14 66 56 163
N13 3 34 128 105
N14 17 95 45 87
N15 0 9 136 156
N16 3 8 147 360
N17 0 10 189 158
N18 1 14 120 53
N19 1 12 36 138


The Table below gives in percentage, the total number of properties purchased as Buy-To-Let:
Postcode Detached Semi-Detached Terraced Flat
N10 22% 3% 8% 19%
N11 20% 11% 3% 23%
N12 21% 17% 13% 27%
N13 33% 15% 13% 10%
N14 12% 11% 13% 11%
N15 0% 11% 35% 29%
N16 0% 38% 19% 18%
N17 0% 50% 26% 25%
N18 100% 43% 31% 40%
N19 0% 8% 3% 7%
*Buy-to-let consists of Buy-to-lets (where they can be identified by a Mortgage) ,transfers to non-private individuals,  transfers under a power of sale/repossessions


Hospital Postcode Town/City
Wolfson House N4 2ES London
Highgate Private Hospital N6 4DJ London
The Whittington Hospital At Hornsey Central N8 8JD London
Moorfields At St Ann's Hospital N15 3TH London
St. Ann's Hospital N15 3TH London
Olive Eden Hospital N17 0ND London
North Middlesex University Hospital N18 1QX London
The Whittington Hospital N19 5NF London


Schools for Postcode Area N


Property Posts for Postcode Area N


All N Postcodes Yearly & Trend Analysis Posts

Reference

N Postcode Area As Per Wikipedia

Comments are closed