12. February 2018 19:46
/
VInsights Team
/
/
Comments (0)
Please click here for the updated version of this post
This Post covers
- Coverage Area of Postcode EC2A to EC2Y
- Total Values of Properties Sold in 2017
- Average Sales Price in 2017
- Median Sales Price in 2017
- Standard Deviation of Sales Price in 2017
- Total Number of Properties Sold in 2017
- Total Number of Buy-To-Let Properties in 2017
- Multi Year Property Trend Analysis
- Schools for Postcode Area EC
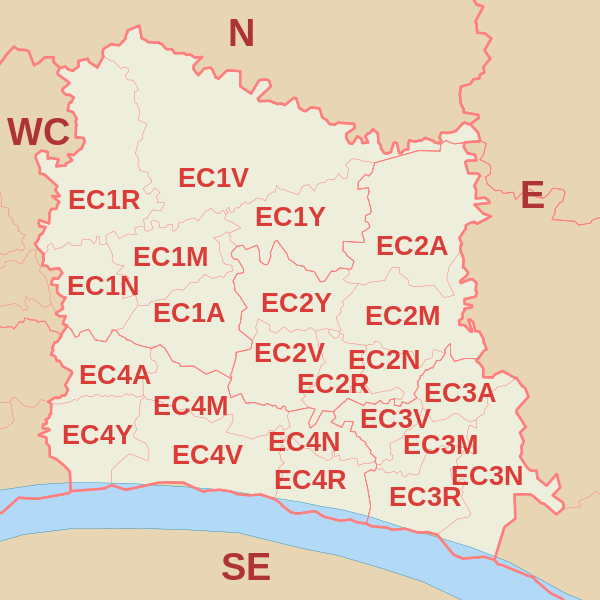
Coverage Area of Postcode EC2A to EC2Y
 |
| Postcode |
Coverage Area |
Local Authority Area |
| EC2A |
Shoreditch |
Islington, Hackney, City of London |
| EC2M |
Broadgate, Liverpool Street |
Tower Hamlets, City of London |
| EC2N |
Old Broad Street, Tower 42 |
City Of London |
| EC2R |
Bank of England |
City Of London |
| EC2V |
Guildhall |
City Of London |
| EC2Y |
Barbican |
City Of London |
Total Value of Properties Sold in 2017
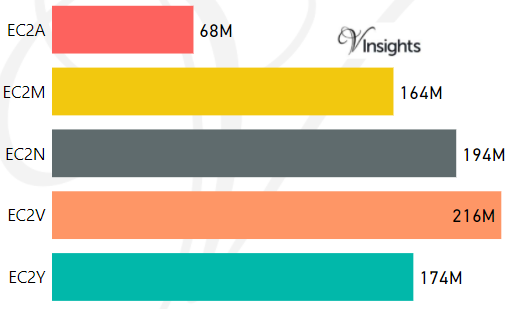
*M represents millions
*Total value includes Property Type Other apart from Detached, Semi-Detached, Terraced, Flat/Masionette
Average Sales Price in 2017
| Postcode |
Detached |
Semi-Detached |
Terraced |
Flat |
| EC2A |
|
|
£1150K |
£732K |
| EC2M |
|
|
|
£553K |
| EC2N |
|
|
|
|
| EC2V |
|
|
|
|
| EC2Y |
|
|
£950K |
£1015K |
Median Sales Price in 2017
| Postcode |
Detached |
Semi-Detached |
Terraced |
Flat |
| EC2A |
|
|
£1150K |
£670K |
| EC2M |
|
|
|
£500K |
| EC2N |
|
|
|
|
| EC2V |
|
|
|
|
| EC2Y |
|
|
£950K |
£855K |
Standard Deviation of Sales Price in 2017
| Postcode |
Detached |
SemiDetached |
Terraced |
Flat |
| EC2A |
|
|
|
£447K |
| EC2M |
|
|
|
£74K |
| EC2N |
|
|
|
|
| EC2V |
|
|
|
|
| EC2Y |
|
|
|
£528K |
For example,
- Say the average detached property price for postcode XYZ is £300 K and ST. DEV. is £30 K.
- It means that most detached properties in postcode XYZ (about 68%) has price within one ST. Dev. i.e. the price range is £270K - £330K.
- All-most all detached property price (95%) in postcode XYZ lie between two ST. Dev. i.e. £240 K - £360 K
Total Number of Properties Sold in 2017
| Postcode |
Detached |
Semi-Detached |
Terraced |
Flat |
| EC2A |
0 |
0 |
2 |
26 |
| EC2M |
0 |
0 |
0 |
2 |
| EC2N |
0 |
0 |
0 |
0 |
| EC2V |
0 |
0 |
0 |
0 |
| EC2Y |
0 |
0 |
1 |
136 |
Total Number of Buy-To-Let Properties in 2017
The Table below gives in percentage, the total number of properties purchased as Buy-To-Let.
| Postcode |
Detached |
Semi-Detached |
Terraced |
Flat |
| EC2A |
0% |
0% |
50% |
8% |
| EC2M |
0% |
0% |
0% |
0% |
| EC2N |
0% |
0% |
0% |
0% |
| EC2V |
0% |
0% |
0% |
0% |
| EC2Y |
0% |
0% |
0% |
4% |
*Buy-to-let consists of Buy-to-lets (where they can be identified by a Mortgage) ,transfers to non-private individuals, transfers under a power of sale/repossessions
Multi Year Property Trend Analysis By Postcode
Schools for Postcode Area EC
- London EC Postcode Area - EC1A, EC1M, EC1N, EC1R, EC1V, EC1Y School Details
- London EC Postcode Area - EC2A, EC2M, EC2N, EC2R, EC2V, EC2Y School Details
- London EC Postcode Area - EC3A, EC3M, EC3N, EC3R, EC3V School Details
- London EC Postcode Area - EC4A, EC4M, EC4N, EC4R, EC4V, EC4Y School Details
Posts for Postcode Area EC
- London EC Postcode Area - EC1A, EC1M, EC1N, EC1R, EC1V, EC1Y Property Market 2017
- London EC Postcode Area - EC3A, EC3M, EC3N, EC3R, EC3V Property Market 2017
- London EC Postcode Area - EC4A, EC4M, EC4N, EC4R, EC4V, EC4Y Property Market 2017
- All EC Postcodes Yearly & Trend Analysis Posts
All EC Postcodes Yearly & Trend Analysis Posts

Reference
EC Postcode Area As Per Wikipedia
2f616d79-fed2-4146-bb29-f4c588d8d1cf|0|.0|27604f05-86ad-47ef-9e05-950bb762570c
Tags :