8. March 2018 22:57
/
VInsights Team
/
/
Comments (0)
Please click here for the updated version of this post
This Post covers
|
|
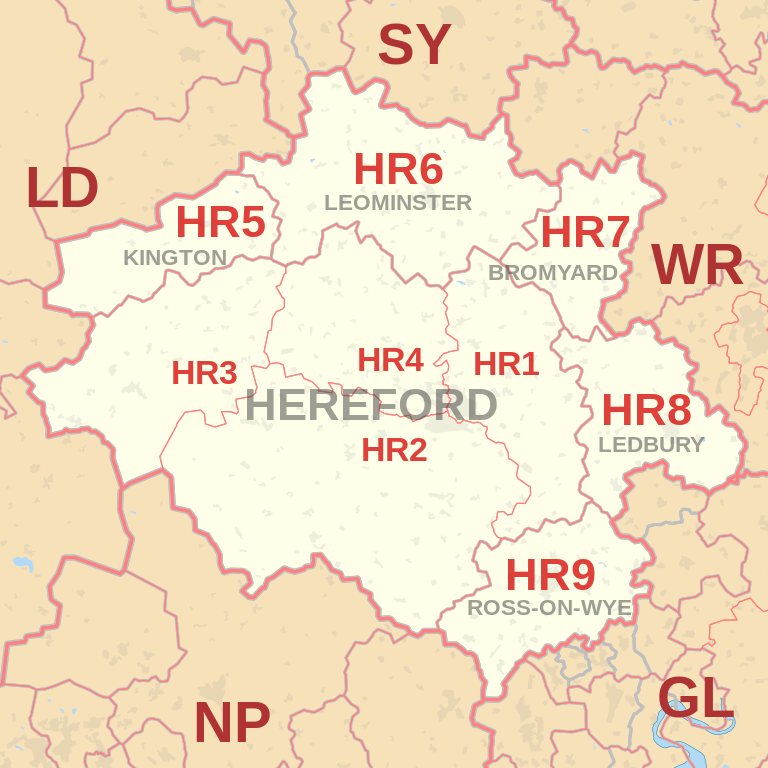
| Postcode |
Coverage Area |
Local Authority Area |
| HR1 |
City centre |
Herefordshire |
| HR2 |
South of City centre |
Herefordshire, Powys |
| HR3 |
West of City centre: Hay on Wye |
Herefordshire, Powys |
| HR4 |
North of centre |
Herefordshire |
| HR5 |
Kington |
Herefordshire, Powys |
| HR6 |
Leominster |
Herefordshire |
| HR7 |
Bromyard |
Herefordshire |
| HR8 |
Ledbury, Bosbury |
Herefordshire |
| HR9 |
Ross-On-Wye |
Herefordshire |
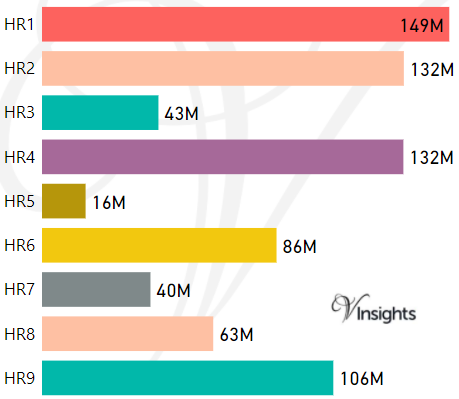
- M represents Million Pounds
- Total value includes Property Type Other apart from Detached, Semi-Detached, Terraced, Flat/Masionette
All HR Postcodes Yearly & Trend Analysis Posts

Reference
HR Postcode Area As Per Wikipedia
345e2aa7-eabb-4d92-b915-c725930f2c93|0|.0|27604f05-86ad-47ef-9e05-950bb762570c
Tags :