Story Highlights
- Greater Manchester had total property sales of £8.12 billions in 2015.
- The total number of properties sold in 2015 in Greater Manchester was 43,818
- The total volume of sales at district level was maximum for Manchester at £1.84 billions
- The average sales price in Greater Manchester was £185 K, whereas median was £137 K
- The average sales price at district level was maximum for Trafford at £285 K
- Similarly the median of sales price at district level was maximum for Trafford at £220 K
- New Property sales in Greater Manchester contributed 8.74% and Not New Property contributed 91.26%
Greater Manchester is one of the counties of North West England. The districts in Greater Manchester are Manchester, Trafford, Stockport, Salford, Wigan, Bolton, Bury, Tameside, Rochdale and Oldham.
Total Sales By Districts
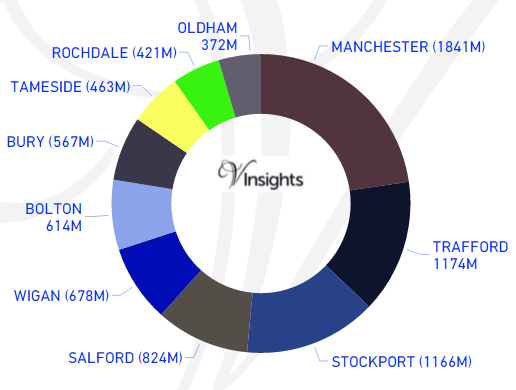
Greater Manchester had total property sales of £8.12 billions which was 37.49% of the North West Property Market 2015.
The split across its districts is as follow:
- Manchester at £1.84 billions (22.67%)
- Trafford at £1.174 billions (14.45%)
- Stockport at £1.16 billions (14.36%)
- Salford at £824 millions (10.14%)
- Wigan at £678 millions (8.35%)
- Bolton at £614 millions (7.56%)
- Bury at £567 millions (6.98%)
- Tameside at £463 millions (5.7%)
- Rochdale at £421 millions (5.19%)
- Oldham at £372 millions (4.59%)
Total Sales By Property Type
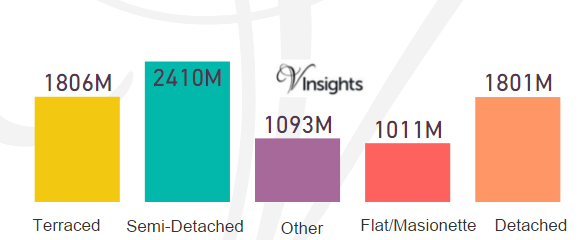
The split of £8.12 billions across the different property types in Greater Manchester are :
- Detached at £1.8 billions (22.18%)
- Terraced at £1.81 billions (22.24%)
- Semi-Detached at £2.4 billions (29.67%)
- Flat/Maisonette at £1.01 billions (12.45%)
- Other at £1.09 billions (13.46%)
Total No Of Properties Sold By Property Type
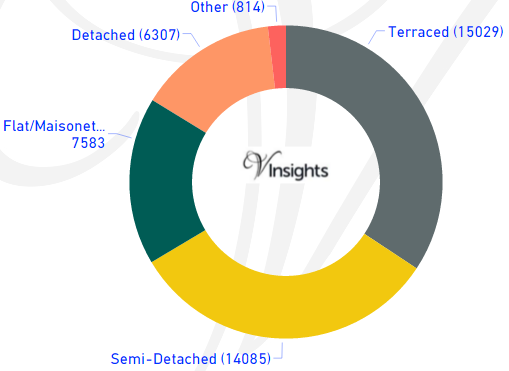
The total property sales of £8.12 billions in 2015 was spread over 43,818 properties.
- Terraced properties at 15,029 (34.3%)
- Detached at 6,307(14.39%)
- Semi-Detached at 14,085 (32.14%)
- Flat/Maisonette at 7,583(17.31%)
- Others at 814 (1.86%)
Average & Median Sales Price
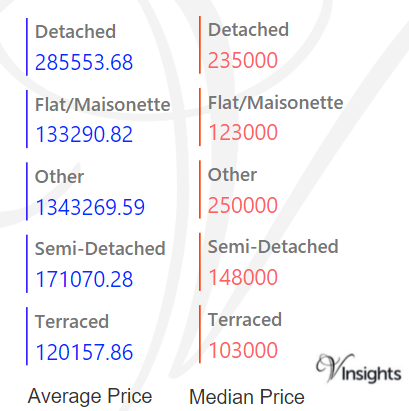
The average sales price in Greater Manchester was £185 K.For the different property types it was:
- Detached at £286 K
- Semi-Detached at £171 K
- Terraced at £120 K
- Flat/Maisonette at £133 K
- Other at £1.34 millions
Similarly median sales price in Greater Manchester was £137 K.For different property types are:
- Detached at £235 K
- Semi-Detached at £148 K
- Terraced at £103 K
- Flat/Maisonette at £123 K
- Other at £250 K
Average & Median Sales Price By Districts
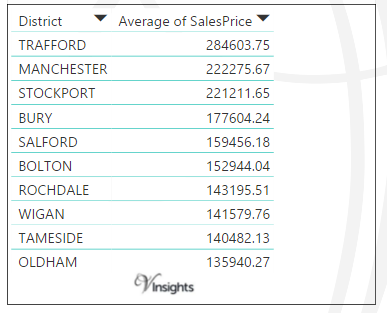
The average sales prices at district level in Greater Manchester for 2015 is as follows:
- Trafford was maximum at £285 K
- Manchester at £222 K
- Stockport at £221 K
- Bury at £178
- Salford at £159
- Bolton at £153
- Rochdale at £143
- Wigan at £142
- Tameside at £141
- Oldham at £136
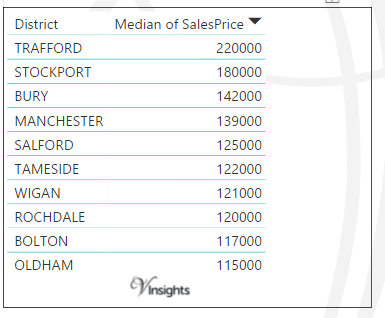
The average sales prices at district level in Greater Manchester for 2015 is as follows:
- Trafford was maximum at £220 K
- Stockport at £180 K
- Bury at £142 K
- Manchester at £139 K
- Salford at £125 K
- Tameside at £122 K
- Wigan at £121 K
- Rochdale at £120 K
- Bolton at £117 K
- with minimum for Oldham at £115 K
New Vs Not New Property Statistics
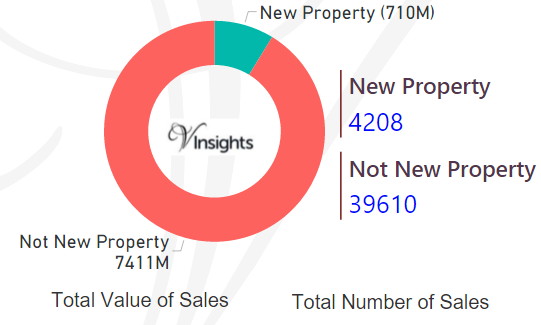
By Sales Values the split is as follows:
- New Properties contributed £710 millions (8.74%)
- Not New Property contributed £7.4 billions (91.26%)
By Total Number the split is as follows:
- New properties sold were 4,208 (9.6%)
- Not new property sold were 39,610 (90.4%).
All Great Manchester Posts

55b0764a-6d44-40a7-af42-1c9caaa3efc5|0|.0|27604f05-86ad-47ef-9e05-950bb762570c