Story Highlights
- Middlesbrough had total Property Sales of £331 millions in 2015
- The total number of properties sold in year 2015 was 2155
- The Average property price was £154 K, while Median was £121 K
- Not New Property contributed 75.04% by value and New Property 24.96% by value
Middlesbrough has unitary authority status in North East England.
Total Sales By Property Type
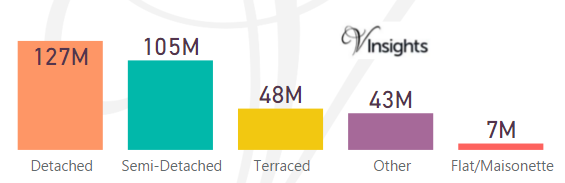
Middlesbrough had total property sales of £331 millions which was 4.88% of the North East Property Market 2015.
The split across the different property types was :
- Detached at £127 millions (38.54%)
- Semi-Detached at £105 millions (31.65%)
- Terraced at £48 millions (14.6%)
- Other at £43 millions (12.96%)
- Flat/Maisonette at £7 millions (2.25%)
Total No Of Properties Sold By Property Type
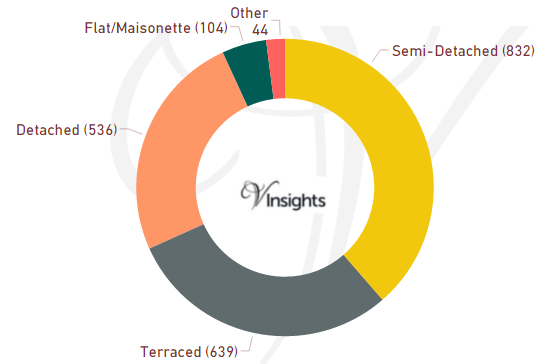
In Middlesbrough the total number of properties sold in year 2015 was 2155. The breakdown by different property types are:
- Terraced 639 (29.65%)
- Semi-Detached 832 (38.61%)
- Detached 536 (24.87%)
- Flat/Maisonette 104 (4.83%)
- Other 44 (2.04%)
Average & Median Sales Price
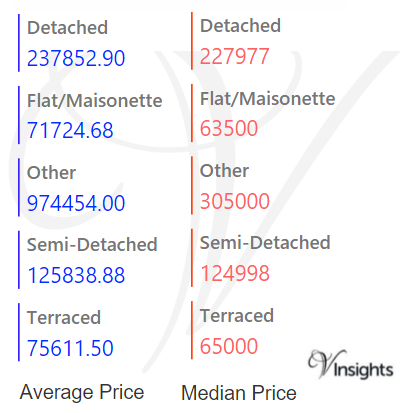
The average sales price in Middlesbrough was £154 K.
For the different property types it was
- Detached at £238 K
- Semi-Detached at £126 K
- Terraced at £76 K
- Flat/Maisonette at £72 K
- Other at £975 K.
Similarly median sales price in Middlesbrough was £121 K.
For the different property types it was
- Detached at £228 K
- Semi-Detached at £125 K
- Terraced at £65 K
- Flat/Maisonette at £64 K
- Other at £305 K
New Vs Not New Property Statistics
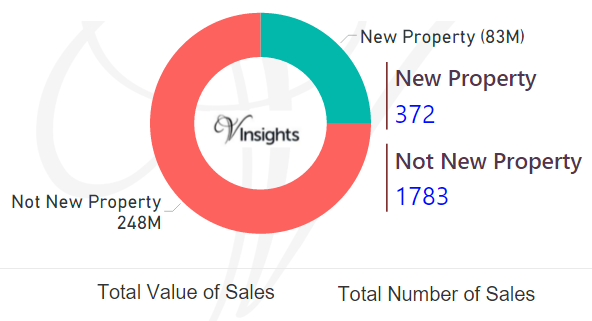
By Value of Sales
- The sales value contributed by New Property was £83 millions (24.96%)
- where as Not New Property contributed £248 millions (75.04%).
By Number of Sales
- New properties sold were 372 (17.26%)
- where as not new property sold were 1783 (82.74%)
All North East England Posts 
9e27d739-a4c7-41d4-9b9c-2dffef0ab6a8|0|.0|27604f05-86ad-47ef-9e05-950bb762570c
Story Highlights
- Hartlepool had total Property Sales of £194 millions in 2015
- The total number of properties sold in year 2015 was 1505
- The Average property price was £129 K, while Median was £110 K
- Not New Property contributed 77.04% by value and New Property 22.96% by value
Hartlepool has unitary authority status in North East England.
Total Sales By Property Type
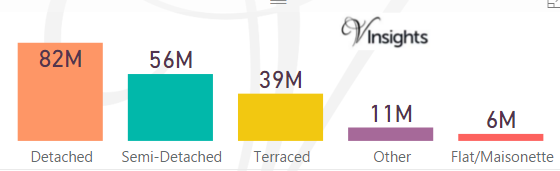
Hartlepool had total property sales of £194 millions which was 2.86% of the North East Property Market 2015.
The split across the different property types was :
- Detached at £82 millions (42.18%)
- Semi-Detached at £56 millions (28.73%)
- Terraced at £39 millions (20.31%)
- Other at £11 millions (5.76%)
- Flat/Maisonette at £6 millions (3.01%)
Total No Of Properties Sold By Property Type
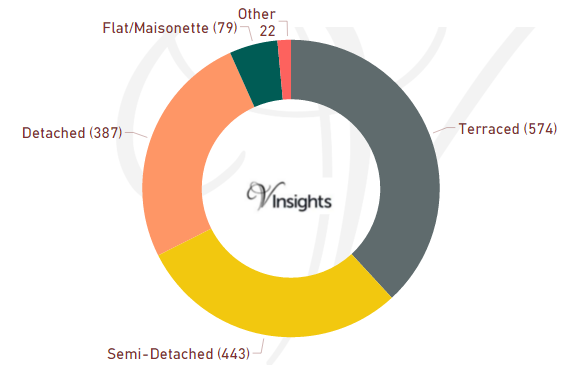
In Hartlepool the total number of properties sold in year 2015 was 1505. The breakdown by different property types are:
- Terraced 574 (38.14%)
- Semi-Detached 443 (29.44%)
- Detached 387 (25.71%)
- Flat/Maisonette 79 (5.25%)
- Other 22 (1.46%)
Average & Median Sales Price
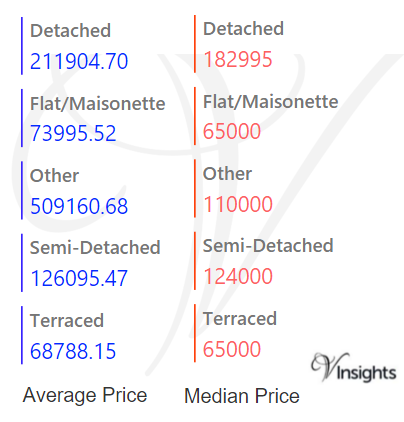
The average sales price in Hartlepool was £129 K.
For the different property types it was
- Detached at £212 K,
- Semi-Detached at £126 K
- Terraced at £69 K
- Flat/Maisonette at £74 K
- Other at £509 K.
Similarly median sales price in Hartlepool was £110 K.
For the different property types it was
- Detached at £183 K
- Semi-Detached at £124 K
- Terraced at £65 K
- Flat/Maisonette at £65 K
- Other at £110 K
New Vs Not New Property Statistics
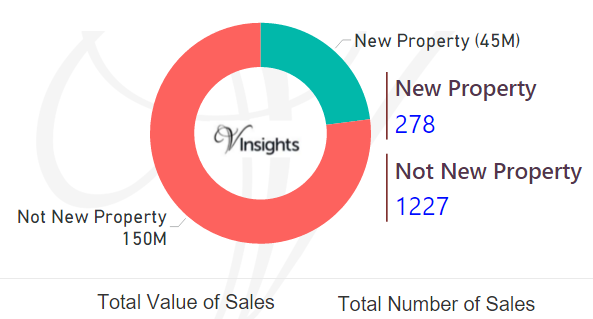
By Value of Sales
- The sales value contributed by New Property was £45 millions (22.96%)
- where as Not New Property contributed £150 millions (77.04%).
By Number of Sales
- New properties sold were 278 (18.47%)
- where as not new property sold were 1227 (81.53%).
All North East England Posts
73108bca-05b6-4ee6-b484-15ff55fd8617|0|.0|27604f05-86ad-47ef-9e05-950bb762570c
Story Highlights
- Darlington had total Property Sales of £309 million in 2015
- The total number of properties sold in year 2015 was 1868
- The Average property price was £165 K, while Median was £128 K
- Not New Property contributed 84.76% by value and New Property 15.24% by value
Darlington has unitary authority status in North East England.
Total Sales By Property Type
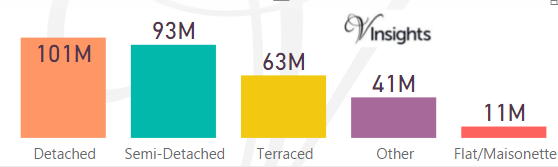
Darlington had total property sales of £309 millions, which was 4.55% of the North East Property Market 2015.
The split across the different property types was:
- Detached at £101 millions (32.59%)
- Semi-Detached at £93 millions (30.24%)
- Terraced at £63 millions (20.31%)
- Other at £41 millions (13.16%)
- Flat/Maisonette at £11 millions (3.69%)
Total No Of Properties Sold By Property Type
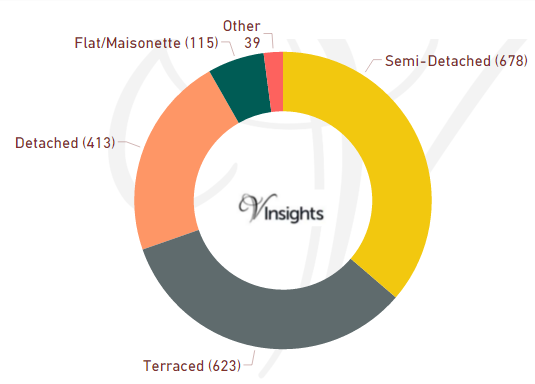
In Darlington the total number of properties sold in year 2015 was 1868. The breakdown by different property types are:
- Terraced 623 (33.35%)
- Semi-Detached 678 (36.3%)
- Detached 413 (22.11%)
- Flat/Maisonette 115 (6.16%)
- Other 39 (2.09%)
Average & Median Sales Price
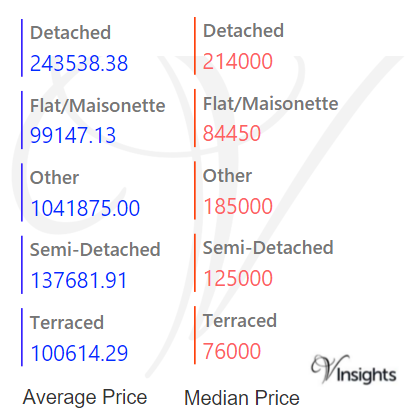
The average sales price in Darlington was £165 K.
For the different property types it was
- Detached at £244 K
- Semi-Detached at £138 K
- Terraced at £101 K
- Flat/Maisonette at £99 K
- Other at £1.04 millions.
Similarly median sales price in Darlington was £128 K.
For the different property types it was
- Detached at £214 K
- Semi-Detached at £125 K
- Terraced at £76 K
- Flat/Maisonette at £84 K
- Other at £185 K
New Vs Not New Property Statistics
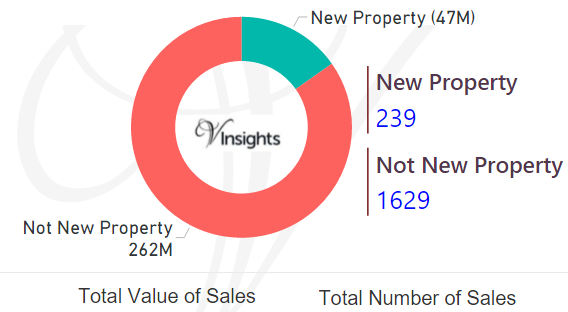
By Value of Sales
- The sales value contributed by New Property was £47 millions (15.24%)
- where as Not New Property contributed £262 millions (84.76%).
By Number of Sales
- New properties sold were 239 (12.79%)
- where as not new property sold were 1629 (87.21%).
All North East England Posts
a744c97b-a1a6-41f9-8d5e-c0b5eba54200|0|.0|27604f05-86ad-47ef-9e05-950bb762570c
Story Highlights
- County Durham had total Property Sales of £1.1 billion in 2015
- The total number of properties sold in year 2015 was 8216
- The Average property price was £135 K, while Median was £103 K
- Not New Property contributed 85.76% by value and New Property 14.24% by value
County Durham has unitary authority status in North East England.
Total Sales By Property Type
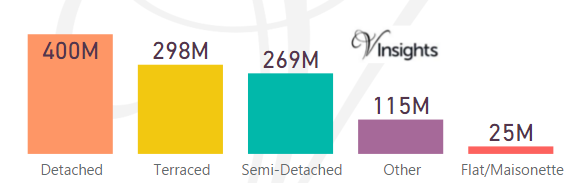
County Durham had total property sales of £1.1 billion, which was 16.31% of the North East Property Market 2015.
The split across the different property types was:
- Detached at £400 millions (36.12%)
- Terraced at £298 millions (26.93%)
- Semi-Detached at £269 millions (24.32%)
- Other at £115 millions (10.37%)
- Flat/Maisonette at £25 millions (2.26%)
Total No Of Properties Sold By Property Type
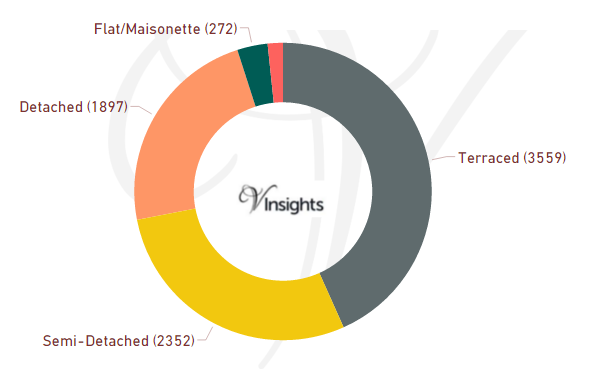
In County Durham the total number of properties sold in year 2015 was 8216. The breakdown by different property types are:
- Terraced 3559 (43.32%)
- Semi-Detached 2352 (28.63%)
- Detached 1897 (23.09%)
- Flat/Maisonette 272 (3.31%)
- Other 136 (1.66%)
Average & Median Sales Price
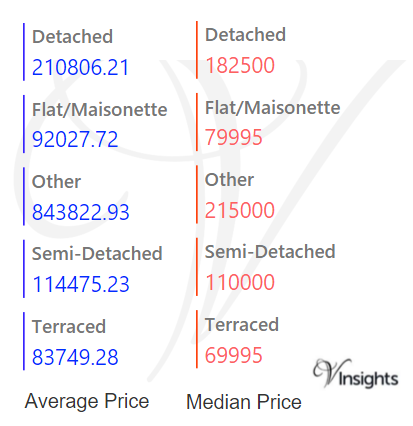
The average sales price in County Durham was £135 K.
For the different property types it was
- Detached at £211 K
- Semi-Detached at £115 K
- Terraced at £84 K
- Flat/Maisonette at £92 K
- Other at £844 K.
Similarly median sales price in County Durham was £103 K.
For the different property types it was
- Detached at £183 K
- Semi-Detached at £110 K
- Terraced at £70 K
- Flat/Maisonette at £80 K
- Other at £215 K
New Vs Not New Property Statistics
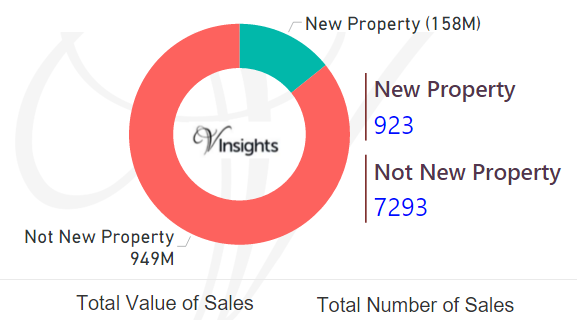
By Value of Sales
- The sales value contributed by New Property was £158 millions (14.24%)
- where as Not New Property contributed £949 millions (85.76%).
By Number of Sales
- New properties sold were 923 (11.23%)
- where as not new property sold were 7293 (88.77%).
All North East England Posts
18547ec6-778d-4f20-b337-4c82e5b2ba2d|0|.0|27604f05-86ad-47ef-9e05-950bb762570c
For 2016 details - North East Property Market 2016
Story Highlights
- North East England had total property sales of £7 billions.
- The total number of properties sold in 2015 was 40,669.
- The total sale at county level was maximum for Tyne And Wear at £3.07 Billions
- The average price in North East England was £167 K while median price was £127 K
- The average sales price at county level was maximum for Tyne And Wear at £184K
- The sales value contributed by New Property was 14.46%, for Not New 85.54 %
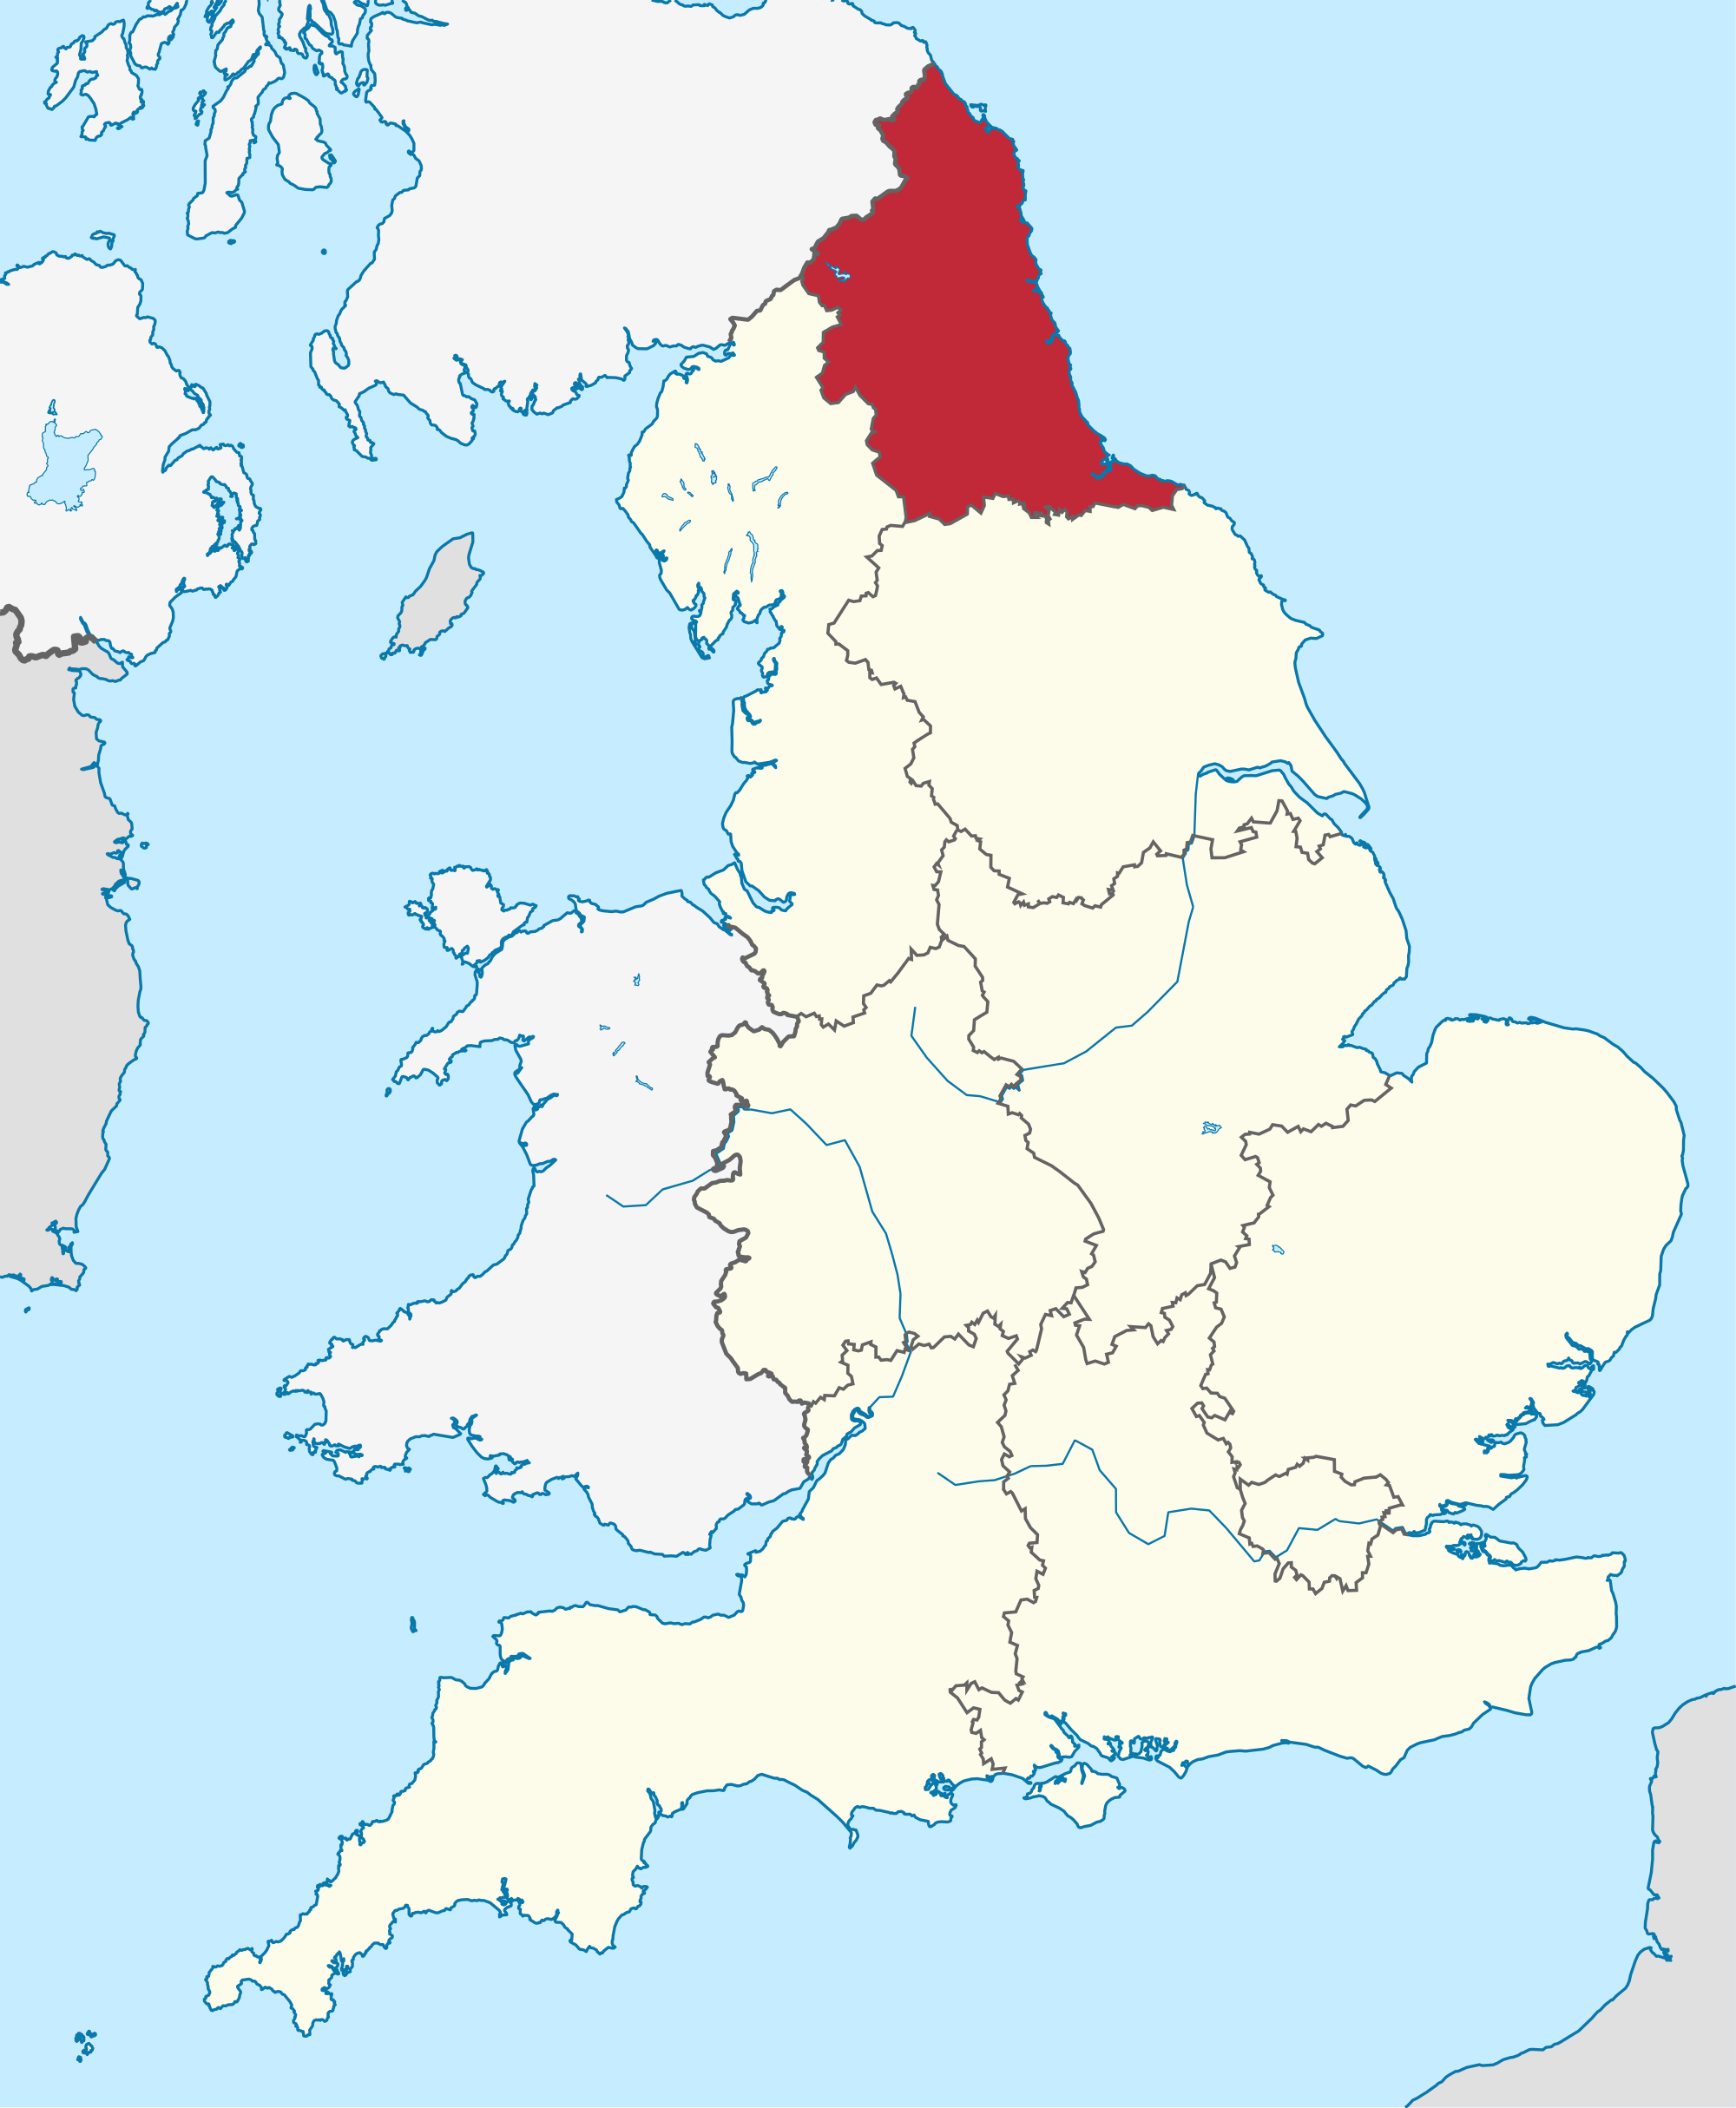
North East England is one of the 9 principal areas of England. It consist of the counties Northumberland, Tyne and Wear, County Durham, Darlington, Hartlepool, Stockton-on-Tees, Redcar and Cleveland, Middlesbrough.
Total Value of Sales By Property Types

North East England had total property sales of £7 billions. It contributed 2.3% of the England Wales Property Market 2015.
The split across the different property types was:
- Detached at £2.09 billions (30.8%)
- Semi-Detached at £1.83 billions (26.91%)
- Terraced at 1.511 billions (22.27%)
- Flat/Maisonette at £454 millions (6.7%)
- Other at 904 millions (13.33%)
Total Sales By County
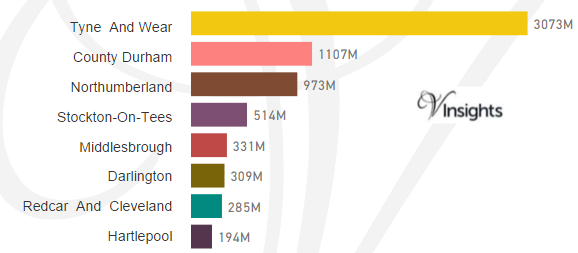
The total sales of £7 Billions in 2015 was split across its counties as above.
Total Number of Sales By Property Types
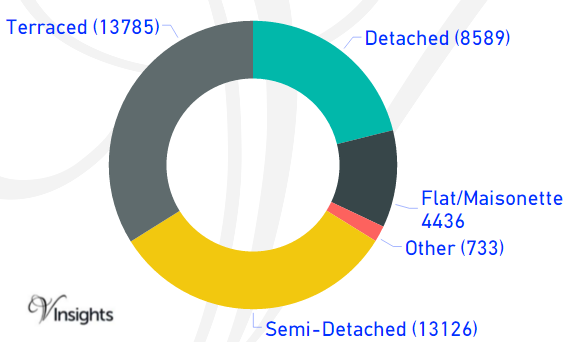
The total property sales of £7 Billions in 2015 was spread over 40,669 properties.
- Terraced properties at 13,785 (33.9%)
- Detached at 8,589 (21.12%),
- Semi-Detached at 13,126 ( 32.28%),
- Flat/Maisonette at 4,436 (10.91%)
- Others at 733 (1.8%).
Average & Median Sales Price
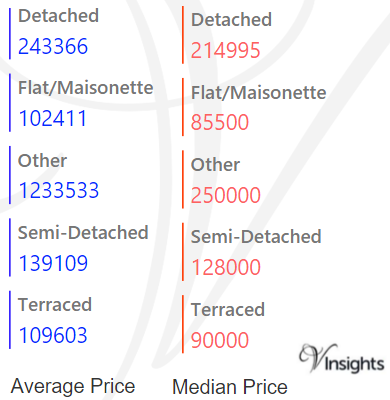
The average sales price in North East England was £167 K.
For the different property types it was
- Detached at £243 K
- Semi-Detached at £139 K
- Terraced at £110 K
- Flat/Maisonette at £102 K
- Other at £1.23 millions.
Similarly median sales price in North East was £127 K.
For the different property types it was
- Detached at £215 K
- Semi-Detached at £128 K
- Terraced at £90 K
- Flat/Maisonette at £85.5 K
- Other at £250 k
Average & Median Sales Price By County
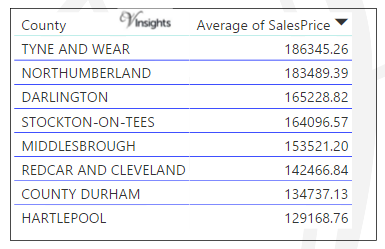
The average sales price in North East in 2015 at county level is as above.
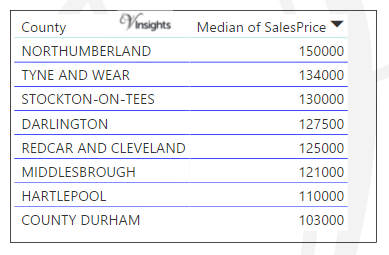
The median sales price in North East in 2015 is as above.
New Vs Not New Property Statistics
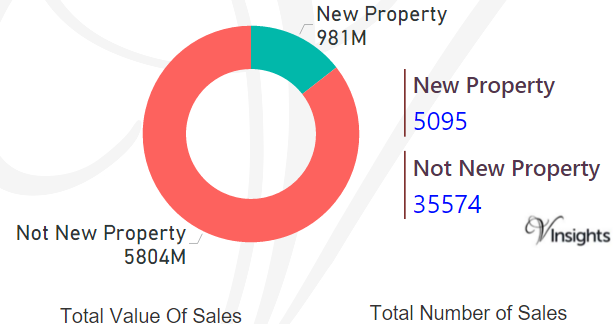
By Value of Sales
- The sales value contributed by New Property was £981 millions (14.46%)
- where as Not New Property contributed £5.80 billions (85.54 %).
By Number of Sales
- New properties sold were 5,095 (12.53%)
- where as not new property sold were 35,574 (87.47%).
All England Posts
8cab46b1-fd51-41cb-bf47-1525625891ec|1|5.0|27604f05-86ad-47ef-9e05-950bb762570c