
Story Highlights
- North East England had total property sales of £7 billions.
- The total number of properties sold in 2016 was 39,847
- The total sales at county level was maximum for Tyne And Wear at £2.94 Billions
- The average price in North East England was £168 K, while median price was £125 K
- The average sales price at county level was maximum for Darlington at £204 K
- The sales value contributed by New Property was 11.16%, for Not New 88.84%
- Stamp duty hike caused monthly spike in March
- Brexit coupled with Stamp Duty Hike has caused stagnation of North East England property market 2016 over 2015
North East England is one of the 9 principal areas of England. It consist of the counties Northumberland, Tyne and Wear, County Durham, Darlington, Hartlepool, Stockton-on-Tees, Redcar and Cleveland, Middlesbrough.
Total Sales By County
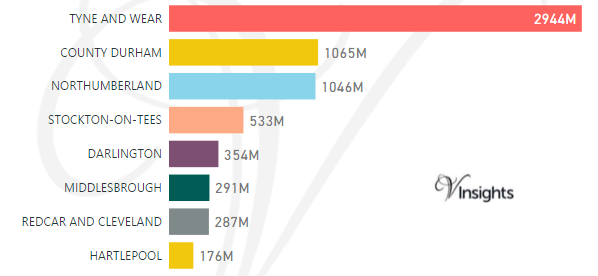
The total sales of £7 Billions in 2016 was split across its counties as above.
Year on Year Comparison : Compared to North East England Property Market 2015 in 2016
Total Value of Sales By Property Types
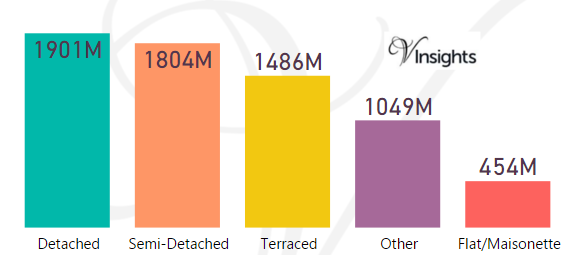
The split of £7 Billions across the different property types was:
- Detached at £1.9 billions (28.4%)
- Semi-Detached at £1.8 billions (26.95%)
- Terraced at £1.49 billions (22.19%)
- Other at £1.05 billions (15.67%)
- Flat/Maisonette at £454 millions (6.78%)
Year on Year Comparison : Compared to North East England Property Market 2015 in 2016
- Detached, Semi-Detached, Terraced had decline in total sales.
- Flat/Maisonette remained constant.
- Other has shown increase of 16.15%
Month-wise Break-up of Total Sales
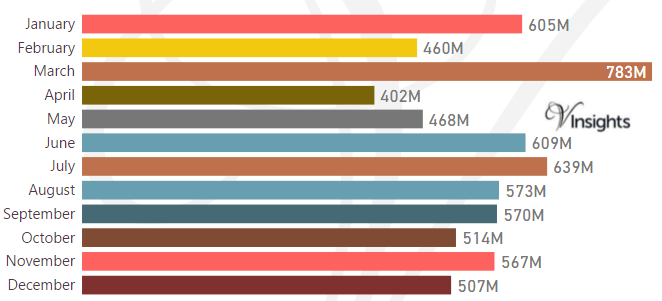
Stamp Duty Hike Impact
- March had property sale spike of £783 millions compared to £460 millions in Feb
- The impetus for it was to avoid the extra 3% in Stamp Duty Tax applicable on buying an additional home, being applicable from April 1 2016
Brexit Impact
- Brexit took place on 23rd June 2016.
- As can be observed from the month-wise break-up there does not seem to have been dip in property sales in the immediate aftermath of Brexit
- Year on Year there has been no growth in 2016 compared to 2015
- Brexit coupled with Stamp Duty seems to have stagnated the property market
Total Number of Sales By Property Types
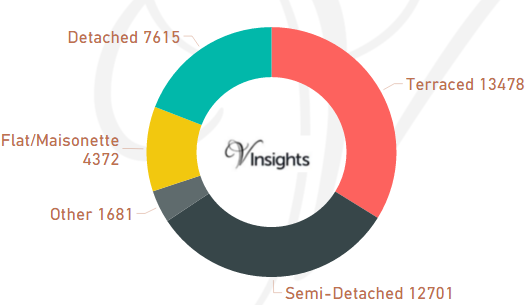
The total property sales of £7 Billions in 2016 was spread over 39,847 properties.
- Terraced properties at 13,478 (33.82%)
- Detached at 7,615 (19.11%)
- Semi-Detached at 12,701 (31.87%)
- Flat/Maisonette at 4,372 (10.97%)
- Others at 1,681 (4.22%)
Year on Year Comparison : Compared to North East England Property Market 2015 in 2016
- Except for property type Other all property types have shown decline in numbers
Average & Median Sales Price
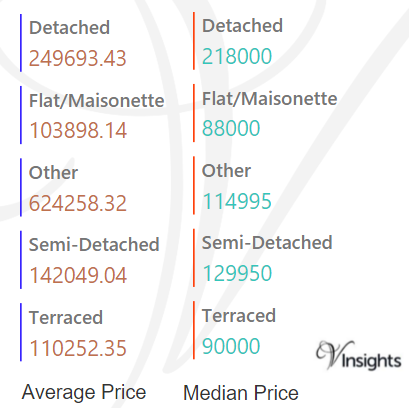
The average sales price in North East England was £168 K
For the different property types it was
- Detached at £250 K
- Semi-Detached at £142 K
- Terraced at £110 K
- Flat/Maisonette at £104 K
- Other at £624 K
Similarly median sales price in North East England was £125 K
For the different property types it was
- Detached at £218 K
- Semi-Detached at £130 K
- Terraced at £90 K
- Flat/Maisonette at £88 K
- Other at £115 k
Year on Year Comparison : Compared to North East England Property Market 2015 in 2016
- All property types have shown increase in average and median sales except property type Other
- Other has shown sharp decline in average and median sales
Average & Median Sales Price By County
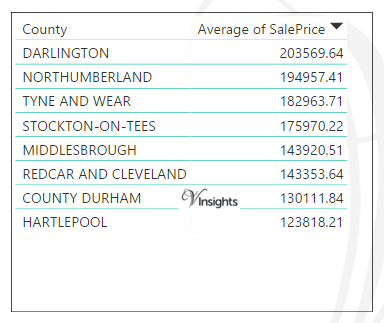
The average sales price in North East England in 2016 at county level is as above.
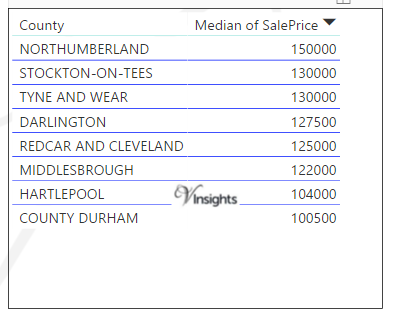
The median sales price in North East England in 2016 is as above.
Year on Year Comparison : Compared to North East England Property Market 2015 in 2016
New Vs Not New Property Statistics
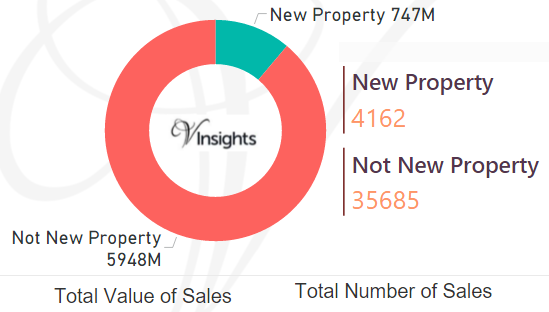
By Value of Sales
- The sales value contributed by New Property was £747 millions (11.16%)
- where as Not New Property contributed £5.95 billions (88.84%)
By Number of Sales
- New properties sold were 4,162(10.44%)
- where as not new property sold were 35,685 (89.56%).
Year on Year Comparison : Compared to North East England Property Market 2015 in 2016
- New property market share in property market has gone down in 2016 over 2015
All England Posts

53a15bab-a190-4ab2-9d51-edfb26ab3625|0|.0|27604f05-86ad-47ef-9e05-950bb762570c
Story Highlights
- Tyne And Wear had total property sales of £3.07 billions in 2015.
- The total number of properties sold in 2015 in Tyne And Wear was 16,489
- The total volume of sales at district level was maximum for Newcastle Upon Tyne at £1.04 billions
- The average sales price in Tyne And Wear was £186 K, whereas median was £134 K
- The average sales price at district level was maximum for Newcastle Upon Tyne at £245 K
- New Property sales contributed 13.56% and Not New Property contributed 86.44%
Tyne And Wear is a county in North East England. The districts of Tyne And Wear are Newcastle Upon Tyne, North Tyneside, Sunderland, Gateshead, South Tyneside.
Total Sales By Districts
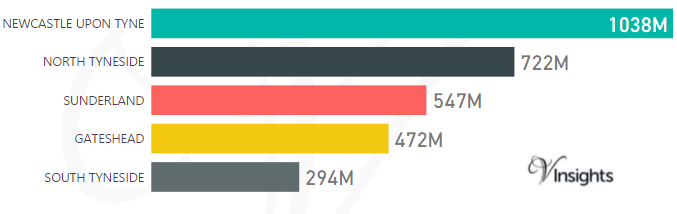
Tyne And Wear had total property sales of £3.07 billions which was 45.28% of the North East Property Market 2015.
The split across its districts is as follow:
- Newcastle Upon Tyne at £1.04 billions (33.77%)
- North Tyneside at £722 millions (23.5%)
- Sunderland at £547 millions (17.8%)
- Gateshead at £472 millions (15.35%)
- South Tyneside at £294 millions (9.57%)
Total Sales By Property Type
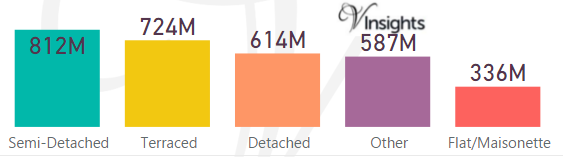
The split of £3.07 billions across the different property types in Tyne And Wear are :
- Semi-Detached at £812 millions (26.42%)
- Terraced at £724 millions (23.55%)
- Detached at £614 millions (19.97%)
- Other at £587 millions (19.12%)
- Flat/Maisonette at £336 millions (10.94%)
Total No Of Properties Sold By Property Type
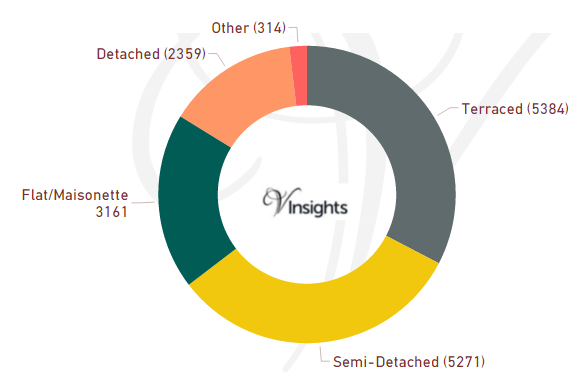
The total property sales of £3.07 billions in 2015 was spread over 16,489 properties.
- Terraced properties at 5384 (32.65%)
- Semi-Detached at 5271 (31.97%)
- Flat/Maisonette at 3161 (19.17%)
- Detached at 2359 (14.31%)
- Others at 314 (1.9%)
Average & Median Sales Price
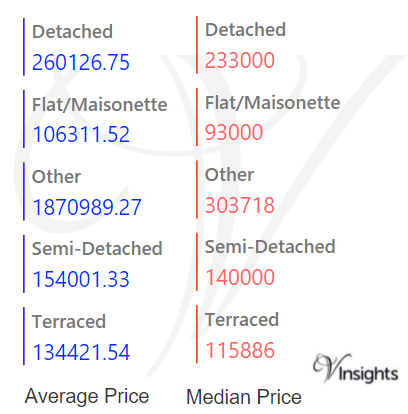
The average sales price in Tyne And Wear was £186 K. For the different property types it was:
- Detached at £260 K
- Semi-Detached at £154 K
- Terraced at £134 K
- Flat/Maisonette at £106 K
- Other at £1.87 millions
Similarly median sales price in Tyne And Wear was £134 K. For different property types it was:
- Detached at £233 K
- Semi-Detached at £140 K
- Terraced at £116 K
- Flat/Maisonette at £93 K
- Other at £304 K
Average & Median Sales Price By Districts

The average sales prices at district level in Tyne And Wear for 2015 is as follows:
- Newcastle Upon Tyne at £245 K
- North Tyneside at £190 K
- Gateshead at £165 K
- Sunderland at £152 K
- South Tyneside at £147 K
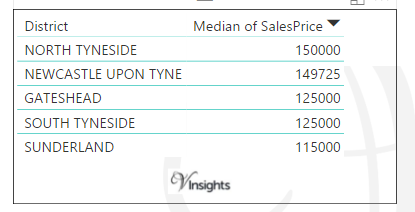
The median sales prices at district level in Tyne And Wear for 2015 is as follows:
- North Tyneside at £150 K
- Newcastle Upon Tyne at £150 K
- Gateshead at £125 K
- South Tyneside at £125 K
- Sunderland at £115 K
New Vs Not New Property Statistics

By Sales Values the split is as follows:
- New Properties contributed £417 millions (13.56%)
- Not New Property contributed £2.66 billions (86.44%)
By Total Number the split is as follows:
- New properties sold were 2039 (12.37%)
- Not new property sold were 14,450 (87.63%).
All Tyne And Wear Posts
360368cb-10ae-48b1-83c4-1af733c908e3|0|.0|27604f05-86ad-47ef-9e05-950bb762570c
Story Highlights
- Stockton-On-Tees had total Property Sales of £514 millions in 2015
- The total number of properties sold in year 2015 was 3132
- The Average property price was £164 K, while Median was £130 K
- Not New Property contributed 86.86% by value and New Property 13.14% by value
Stockton-On-Tees has unitary authority status in North East England.
Total Sales By Property Type
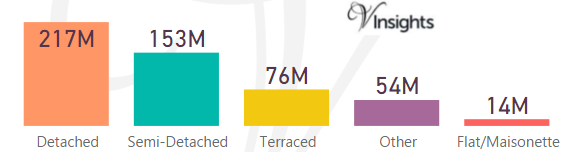
Stockton-On-Tees had total property sales of £514 millions which was 7.57% of the North East Property Market 2015.
The split across the different property types was :
- Detached at £217 millions (42.19%)
- Semi-Detached at £153 millions (29.77%)
- Terraced at £76 millions (14.8%)
- Other at £54 millions (10.52%)
- Flat/Maisonette at £14 millions (2.72%)
Total No Of Properties Sold By Property Type
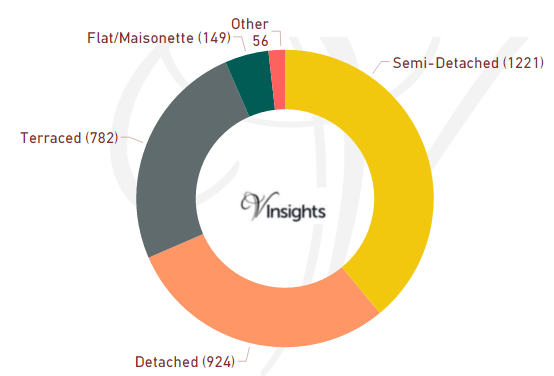
The total property sales of £514 millions in 2015 was spread over 3132 properties.
- Terraced properties at 782 (24.97%)
- Detached at 924 (29.5%),
- Semi-Detached at 1221 (38.98%),
- Flat/Maisonette at 149 (4.76%)
- Others at 56 (1.79%).
Average & Median Sales Price
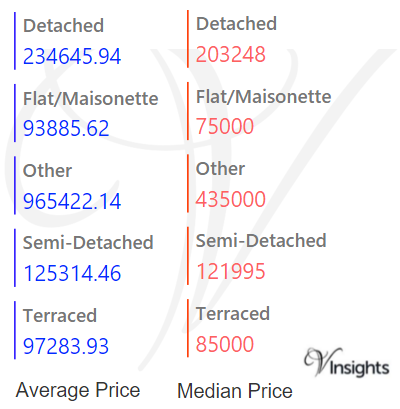
The average sales price in Stockton-On-Tees was £164 K.
For the different property types it was
- Detached at £235 K
- Semi-Detached at £125 K
- Terraced at £97 K
- Flat/Maisonette at £94 K
- Other at £965 K.
Similarly median sales price in Stockton-On-Tees was £130 K.
For the different property types it was
- Detached at £203 K
- Semi-Detached at £122 K
- Terraced at £85 K
- Flat/Maisonette at £75 K
- Other at £435 K
New Vs Not New Property Statistics
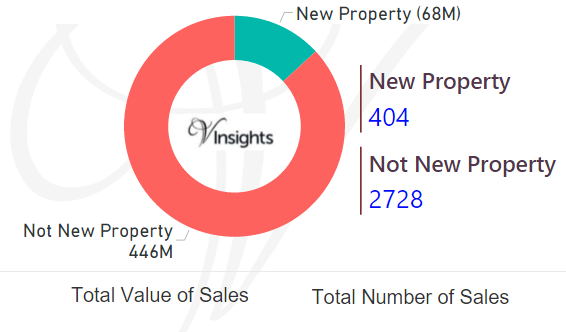
By Value of Sales
- The sales value contributed by New Property was £68 millions (13.14%)
- where as Not New Property contributed £446 millions (86.86%).
By Number of Sales
- New properties sold were 404 (12.9%)
- where as not new property sold were 2728 (87.1%).
All North East England Posts
b48ad203-6848-4716-a52b-a27131256d0c|0|.0|27604f05-86ad-47ef-9e05-950bb762570c
Story Highlights
- Redcar And Cleveland had total Property Sales of £285 millions in 2015
- The total number of properties sold in year 2015 was 2002
- The Average property price was £143 K, while Median was £125 K
- Not New Property contributed 86.53% by value and New Property 13.47% by value
Redcar And Cleveland has unitary authority status in North East England.
Total Sales By Property Type
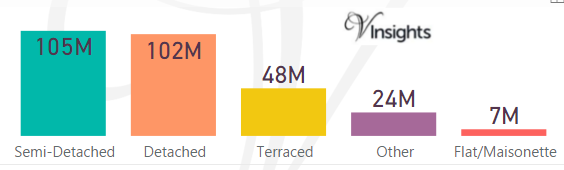
Redcar And Cleveland had total property sales of £285 millions which was 4.2% of the North East Property Market 2015.
The split across the different property types was :
- Semi-Detached at £105 millions (36.94%)
- Detached at £102 millions (35.77%)
- Terraced at £48 millions (16.73%)
- Other at £24 millions (8.24%)
- Flat/Maisonette at £7 millions (2.33%)
Total No Of Properties Sold By Property Type
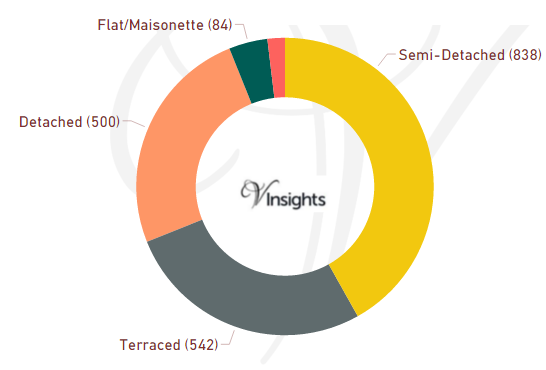
The total property sales of £285 millions in 2015 was spread over 2002 properties.
- Terraced properties at 542 (27.07%)
- Detached at 500 (24.98%),
- Semi-Detached at 838 (41.86%),
- Flat/Maisonette at 84 (4.2%)
- Others at 38 (1.9%).
Average & Median Sales Price
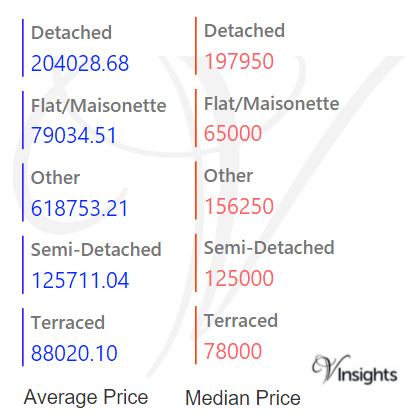
The average sales price in Redcar And Cleveland was £143 K.
For the different property types it was
- Detached at £204 K
- Semi-Detached at £126 K
- Terraced at £88 K
- Flat/Maisonette at £79 K
- Other at £619 K.
Similarly median sales price in Redcar And Cleveland was £125 K.
For the different property types it was
- Detached at £198 K
- Semi-Detached at £125 K
- Terraced at £78 K
- Flat/Maisonette at £65 K
- Other at £156 K
New Vs Not New Property Statistics
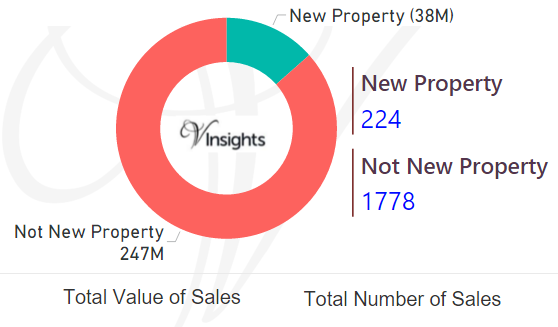
By Value of Sales
- The sales value contributed by New Property was £38 millions (13.47%)
- where as Not New Property contributed £247 millions (86.53%)
By Number of Sales
- New properties sold were 224 (11.19%)
- where as not new property sold were 1778 (88.81%).
All North East England Posts
1b6527d1-5326-4d3b-bbf6-4a78f68975ed|0|.0|27604f05-86ad-47ef-9e05-950bb762570c
Story Highlights
- Northumberland had total Property Sales of £973 millions in 2015
- The total number of properties sold in year 2015 was 5302
- The Average property price was £184 K, while Median was £150 K
- Not New Property contributed 86.96% by value and New Property 13.04% by value
Northumberland has unitary authority status in North East England.
Total Sales By Property Type
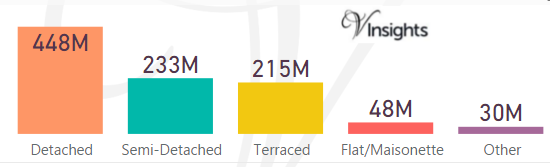
Northumberland had total property sales of £973 millions which was 14.34% of the North East Property Market 2015.
The split across the different property types was :
- Detached at £448 millions (46.03%)
- Semi-Detached at £233 millions (23.92%)
- Terraced at £215 millions (22.08%)
- Other at £30 millions (3.05%)
- Flat/Maisonette at £48 millions (4.92%)
Total No Of Properties Sold By Property Type
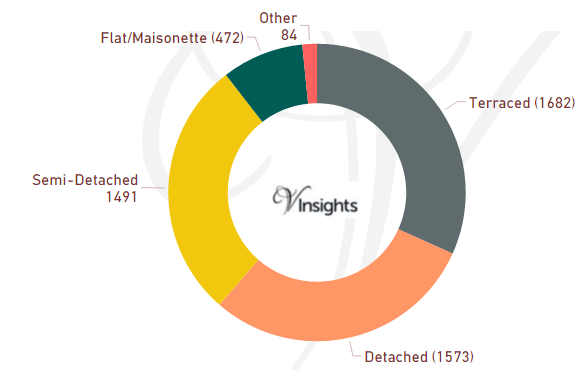
The total property sales of £973 millions in 2015 was spread over 5302 properties.
- Terraced properties at 1682 (31.72%)
- Detached at 1573 (29.76%),
- Semi-Detached at 1491 (28.12%),
- Flat/Maisonette at 472 (8.9%)
- Others at 84 (1.58%).
Average & Median Sales Price
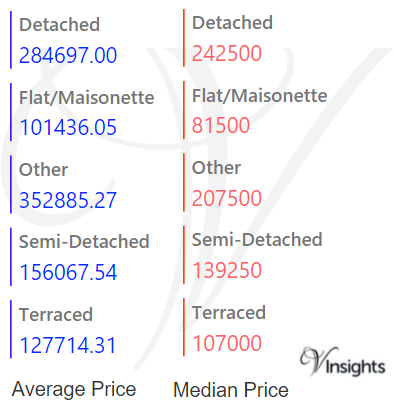
The average sales price in Northumberland was £184 K.
For the different property types it was
- Detached at £285 K
- Semi-Detached at £156 K
- Terraced at £128 K
- Flat/Maisonette at £101 K
- Other at £353 K.
Similarly median sales price in Northumberland was £150 K.
For the different property types it was
- Detached at £243 K
- Semi-Detached at £139 K
- Terraced at £107 K
- Flat/Maisonette at £82 K
- Other at £208 K
New Vs Not New Property Statistics
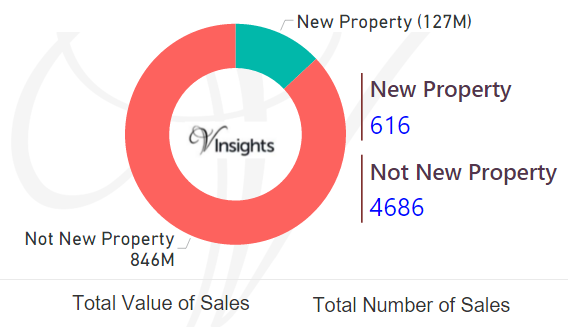
By Value of Sales
- The sales value contributed by New Property was £127 millions (13.04%)
- where as Not New Property contributed £846 millions (86.96%).
By Number of Sales
- New properties sold were 616 (11.62%)
- where as not new property sold were 4686 (88.38%).
All North East England Posts
e85b4ac5-0526-4c74-b4d9-c51f20e6f620|0|.0|27604f05-86ad-47ef-9e05-950bb762570c