Norfolk Property Market 2015

Story Highlights

  • Norfolk had total property sales of £3.9 Billions in 2015.
  • The total number of properties sold in 2015 in Essex was 17,734
  • The total volume of sales at district level was maximum for South Norfolk at £658 millions
  • The average sales price in Norfolk was £221 K whereas median was £185 K
  • The average sales at district level was maximum for North Norfolk at £244 K
  • Similarly the median of sales price at district level was maximum for Broadland at £212 K
  •  New Property sales in Norfolk contributed 9.41% and Not New Property contributed 90.59%


Norfolk is a county in East of England.  The districts in Norfolk are South Norfolk, Breckland, Broadland, Great Yarmouth, King's Lynn and West Norfolk, North Norfolk, Norwich.


Total Sales By Districts

Norfolk - Total Sales By Districts

 Norfolk has total sales of £3.9 Billions. It was 11.36% of East England Property Market 2015. 

The split across its districts is as follow:

  • South Norfolk was maximum at £658 millions (16.81%)
  • King's Lynn and West Norfolk at £647 millions (16.53%)
  • Breckland at £603 millions (15.41%)
  • North Norfolk at £596 millions (15.24%)
  • Broadland at £565 millions (14.44%)
  • Norwich at £541 millions (13.82%)
  • With minimum for Great Yarmouth at £303 millions (7.74%)


Total Sales By Property Type

Norfolk - Total Sales By Property Type

The split of £3.9 Billions across the different property types in Norfolk are:

  • Detached at £1.964 billions (50.18%)
  • Terraced at £775 millions (19.81%)
  • Semi-Detached at £760 millions (19.41%)   
  • Flat/Maisonette at £212 millions (5.41%) 
  • Other at £203 millions (5.18%)


Total No Of Properties Sold By Property Type

Norfolk - Total No Of Properties Sold By Property Type

The total property sales of £3.9 Billions in 2015 was spread over 17,734 properties.

  • Terraced properties at 4,666 (26.31%) 
  • Detached at 7,072 (39.88%)
  • Semi-Detached at 4,137 (23.33%)  
  • Flat/Maisonette at 1,619 (9.13%)
  • Others at 240 (1.35%). 


Average & Median Sales Price

Norfolk - Average & Median Sales Price

The average sales price in Norfolk was £221 K. For the different property types it was:

  • Detached at £278 K
  • Semi-Detached at £184 K
  • Terraced at £166 K
  • Flat/Maisonette at £131 K
  • Other it is at £845 K.


Similarly median sales price in Norfolk was £185 K. For the different property types it was:

  • Detached at £248 K
  • Semi-Detached at £170 K
  • Terraced at £150 K
  • Flat/Maisonette at £120 K
  • Other it is at £250 K


Average & Median Sales Price By Districts

Norfolk - Average Sales Price By Districts

The average sales prices at district level in Essex for 2015 is as follows:

  • North Norfolk was maximum at £244 K
  • South Norfolk at £244 K
  • Broadland at £242 K
  • Breckland at £214 K
  • King's Lynn and West Norfolk at £214 K
  • Norwich at £209 K
  • With minimum for Great Yarmouth at £165 K


Norfolk - Median Sales Price By Districts

The average median sales prices at district level in Essex for 2015 is as follows:

  • Broadland was maximum at £212 K
  • North Norfolk at £210 K
  • South Norfolk at £210 K
  • Breckland at £180 K
  • King's Lynn and West Norfolk at £170 K
  • Norwich at £168 K
  • With minimum for Great Yarmouth at £148 K


New Vs Not New Property Statistics

Norfolk - New Vs Not New Property Statistics

By Sales Values the split is as follows:

  • New Properties contributed £368 millions (9.41%) 
  • Not New Property contributed £3.6 billions (90.59%)


By Total Number the split is as follows:

  • New properties sold were 1,573 (8.87%)
  • Not new property sold were 16,161 (91.13%).


All Norkfolk Posts

Luton Property Market 2015

Story Highlights

  • Luton had total property sales of £655 millions in 2015.
  • The total number of properties sold in 2015 in Luton was 2,930
  • The average sales price in Luton was £223 K and the median was £190 K
  •  New Property sales contributed 3.69% and  Not New Property contributed 96.31%


Luton has unitary authority status in East England Property Market 2015. 

Total Sales By Property Type

Luton - Total Sales By Property Type

Luton had total property sales of £655 millions  which was 1.9% of  East England Property Market 2015.  

The split across the different property types are :

  • Detached at £111 millions (17.02%)
  • Terraced at £176 millions (26.86%)
  • Semi-Detached at £222 millions (33.85%)   
  • Flat/Maisonette at £61 millions (9.3%) 
  • Other at £85 millions (12.97%)


Total No Of Properties Sold By Property Type

Luton - Total No Of Properties Sold By Property Type

The total property sales of £655 millions in 2015 was spread over 2,930 properties.

  • Terraced properties at 979 (33.41%) 
  • Detached at 348 (11.88%)
  • Semi-Detached at 1,011 (34.51%)  
  • Flat/Maisonette at 537 (18.33%)
  • Others at 55 (1.88%). 


Average & Median Sales Price

Luton - Average & Median Sales Price

The average sales price in Luton was £223 K. For the different property types it was:

  • Detached at £320 K
  • Semi-Detached at £219 K
  • Terraced at £180 K
  • Flat/Maisonette at £113 K
  • Other it is at £1.544 millions.


Similarly median sales price in Luton was £190 K. For the different property types it was:

  • Detached at £300 K
  • Semi-Detached at £215 K
  • Terraced at £175 K
  • Flat/Maisonette at £113 K
  • Other it is at £493 K


New Vs Not New Property Statistics

Luton - New Vs Not New Property Statistics

By Sales Values the split is as follows:

  • New Properties contributed £24 millions (3.69%) 
  • Not New Property was £631 millions (96.31%)


By Total Number the split is as follows:

  • New properties sold were 117  (3.99%)
  • Not new property sold were 2,813 (96.01%)


All East of England Posts

Hertfordshire Property Market 2015

Story Highlights


  • Hertfordshire had total property sales of £8.85 billions in 2015.
  • The total number of properties sold in 2015 in Hertfordshire was 21,506
  • The total volume of sales at district level was maximum for St Albans at £1.5 billions
  • The average sales price in Hertfordshire was £411 K whereas median was £325 K
  • The average sales at district level was maximum for St Albans at £533 K
  • Similarly the median of sales price  was maximum for St Albans at £445 K
  • New Property sales contributed 8.7% and Not New Property contributed 91.3%


Hertfordshire is one of the counties of East England. The districts of Hertfordshire are St Albans, Dacorum, East Hertfordshire, Hertsmere, North Hertfordshire, Three Rivers, Welwyn Hatfield, Watford, Broxbourne, Stevenage.

Let us look at the Hertfordshire Property Market in 2015 in detail.


 Total Sales By Districts

Hertfordshire - Total Sales By Districts

The total sales of Hertfordshire £8.85 Billions in 2015 contributed 25.68% of East England Property Market 2015. 

The split across its districts is as follow:

  • St Albans was maximum at £1.5 billions (16.81%)
  • Dacorum at £1.25 billions (14.11%)
  • East Hertfordshire at £1.2 billions (13.61%)
  • Hertsmere at £922 millions (10.42%)
  • North Hertfordshire at £870 millions (9.83%)
  • Three Rivers at £783 millions (8.85%)
  • Welwyn Hatfield at £703 millions (7.94%)
  • Watford at £678 millions (7.67%)
  • Broxbourne at £534 millions (6.04%)
  • With minimum for Stevenage at £417 millions (4.71%)


Total Sales By Property Type

Hertfordshire - Total Sales By Property Type

The split of £8.85 billions across the different property types in Hertfordshire are:

  • Detached at £2.9 billions (32.75%)
  • Terraced at £2.1 billions (23.74%)
  • Semi-Detached at £1.9 billions (21.2%)   
  • Flat/Maisonette at £2.1 billions (16.28%) 
  • Other at £533 millions (6.03%)


Total No Of Properties Sold By Property Type

Hertfordshire - Total No Of Properties Sold By Property Type

The total property sales of £8.85 billions in 2015 was spread over 21,506 properties.

  • Terraced properties at 6,449 (29.99%) 
  • Detached at 4,059 (18.87%)
  • Semi-Detached at 4,392 (20.42%)  
  • Flat/Maisonette at 6,234 (28.99%)
  • Others at 372 (1.73%). 


Average & Median Sales Price

Hertfordshire - Average & Median Sales Price

The average sales price in Hertfordshire was £411 K. For the different property types it was:

  • Detached at £714 K
  • Semi-Detached at £427 K
  • Terraced at £326 K
  • Flat/Maisonette at £231 K
  • Other it is at £1.43 millions.


Similarly median sales price in Hertfordshire was £325 K. For the different property types it was:

  • Detached at £605 K
  • Semi-Detached at £395 K
  • Terraced at £300 K
  • Flat/Maisonette at £212 K
  • Other it is at £500 K


Average & Median Sales Price By Districts

Hertfordshire - Average Sales Price By Districts

The average of sales prices at district level in Hertfordshire for 2015 is as follows:

  • St Albans had maximum average sales price at £533 K
  • Three Rivers at £513 K
  • Hertsmere at £490 K
  • Dacorum at £418 K
  • Welwyn Hatfield at £395 K
  • East Hertfordshire at £389 K
  • Watford at £381 K
  • North Hertfordshire at £338 K
  • Broxbourne at £319 K
  • With minimum for Stevenage at £294 K


Hertfordshire - Median Sales Price By Districts

  • St Albans had maximum average sales price at £445 K
  • Three Rivers at £420 K
  • Hertsmere at £390 K
  • East Hertfordshire at £325 K
  • Dacorum at £325 K
  • Watford at £300 K
  • Welwyn Hatfield at £300 K
  • Broxbourne at £290 K
  • North Hertfordshire at £282 K
  • With minimum for Stevenage at £225 K


New Vs Not New Property Statistics

Hertfordshire - New Vs Not New Property Statistics

By Sales Values the split is as follows:

  • New Properties contributed £769 millions (8.7%) 
  • Not New Property was £8.08 billions (91.3%)


By Total Number the split is as follows:

  • New properties sold were 1,964  (9.13%)
  • Not new property sold were 19,542 (90.87%).


All Hertfordshire Posts


Essex Property Market 2015

Story Highlights

  • Essex had total property sales of £8.79 billions in 2015.
  • The total number of properties sold in 2015 in Essex was 29,210
  • The total volume of sales at district level was maximum for Chelmsford at £1.7 Billions
  • The average sales price in Essex was £301 K whereas median was £250 K
  • The average sales price at district level was maximum for Epping Forest at £462 K 
  • Similarly the median of sales price at district level was maximum for Epping Forest at £378 K
  •  New Property sales in Essex contributed 9.94% and  Not New Property contributed 90.06%


Essex is one of the counties of East England. The districts of Essex are Chelmsford, Epping Forest, Colchester, Basildon, Braintree, Uttlesford, Brentwood, Tendring, Rochford, Castle Point, Maldon, Harlow.

Let us look at the Essex Property Market in 2015 in detail.


 Total Sales By Districts
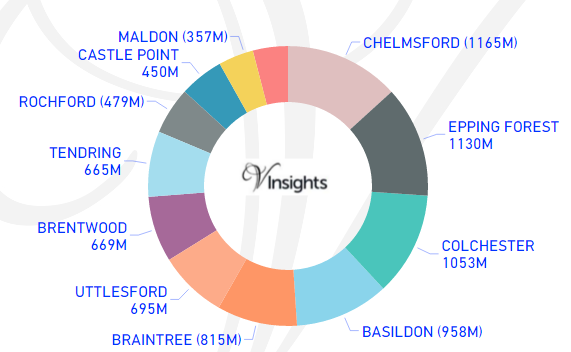
Essex -  Total Sales By Districts


The total sales of £8.79 Billions in 2015 contributed 25.53% of East England Property Market 2015. 

The split across its districts is as follow:

  • Chelmsford was maximum at £1.17 Billions (13.25%)  
  • Epping Forest  at £1.13 billions (12.85%)
  • Colchester  at £1.05 billions (11.98%)
  • Basildon at £958 millions (10.89%)
  • Braintree at £815 millions (9.27%)
  • Uttlesford at £695 millions (7.91%)
  • Brentwood at £669 millions (7.61%) 
  • Tendring at £665 millions (7.57%)
  • Rochford at £479 millions (5.44%)
  • Castle Point at £450 millions (5.12%)
  • Maldon at £357 millions (4.06%)
  • With minimum for Harlow at £356 millions (4.05%)


Total Sales By Property Type
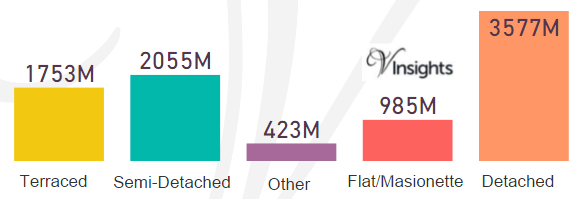
Essex - Total Sales By Property Type

The split of £8.79 billions across the different property types in Essex are:

  • Detached at £3.577 billions (40.68%)
  • Terraced at £1.75 billions (19.93%)
  • Semi-Detached at £2.06 billions (23.37%)   
  • Flat/Maisonette at £985 millions (11.2%) 
  • Other at £423 millions (4.81%)


Total No Of Properties Sold By Property Type
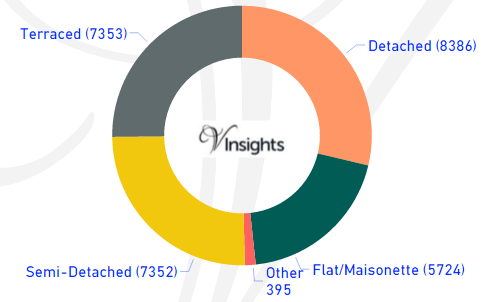
Essex - Total No Of Properties Sold By Property Type

The total property sales of £8.79 billions in 2015 was spread over 29,210 properties.

  • Terraced properties at 7,353 (25.17%) 
  • Detached at 8,386 (28.71%)
  • Semi-Detached at 7,352 (25.17%)  
  • Flat/Maisonette at 5,724 (19.6%)
  • Others at 395 (1.35%). 


Average & Median Sales Price
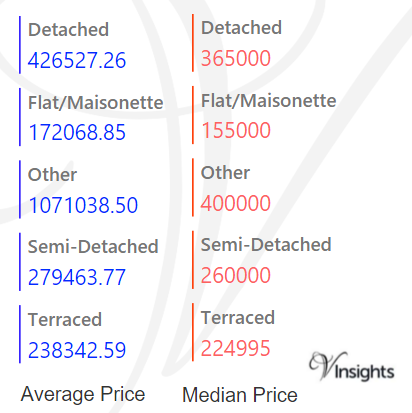
Essex - Average & Median Sales Price

The average sales price in Essex  was £301 K. For the different property types it was:

  • Detached at £427 K
  • Semi-Detached at £280 K
  • Terraced at £238 K,
  • Flat/Maisonette at £172 K
  • Other it is at £1.07 millions.


Similarly median sales price in Essex  was £250 K. For the different property types it was:

  • Detached at £365 K
  • Semi-Detached at £260 K
  • Terraced at £225 K
  • Flat/Maisonette at £155 K
  • Other it is at £400 K


Average & Median Sales Price By Districts
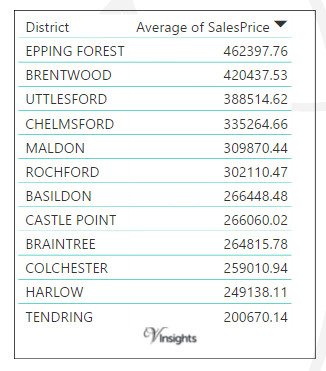
Essex - Average Sales Price By Districts

The average sales prices at district level in Essex for 2015 is as follows:

  • Epping Forest had maximum average sales price at £462 K
  • Brentwood at £420 K
  • Uttlesford at £389 K
  • Chelmsford at £335 K
  • Maldon at £310 K
  • Rochford at £302 K
  • Basildon at £267 K
  • Castle Point at £266 K
  • Braintree at £265 K
  • Colchester at £259 K
  • Harlow at £249 K
  • With minimum average sales price for Tendring at £201 K
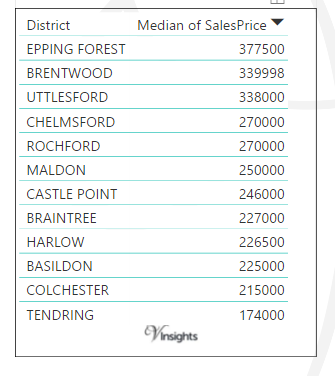
 

Essex - Median Sales Price By Districts

The average of median price at district level in Essex for 2015 is as follows.

  • Epping Forest had maximum median sales price at £378 K
  • Brentwood at £340 K
  • Uttlesford at £338 K
  • Chelmsford at £270 K  
  • Rochford at £270 K
  • Maldon at £250 K
  • Castle Point at £246 K
  • Braintree at £227 K
  • Harlow at £227 K
  • Basildon at £225 K
  • Colchester at £215 K
  • With minimum of median sales price for Tendring at £174 K


New Vs Not New Property Statistics
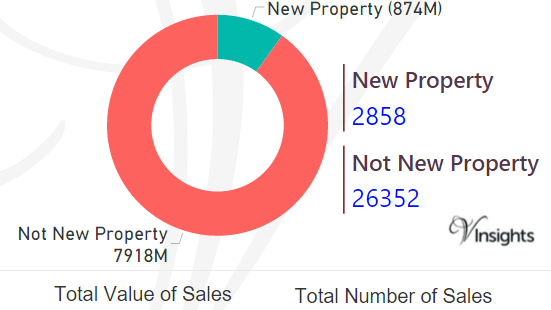
Essex - New Vs Not New Property Statistics

By Sales Values the split is as follows:

  • New Properties contributed £874 millions (9.94%) 
  • Not New Property contributed £7.92 billions (90.06%)


By Total Number the split is as follows:

  • New properties sold were 2,858  (9.78%)
  • Not new property sold were 26,352 (90.22%).


All England Posts


Peterborough Property Market 2015

Story Highlights

  • Peterborough had total property sales of £801 millions in 2015
  • The total number of properties sold in 2015 was 3,487.
  • The average sales price in City Of Peterborough was £230 K whereas median was £150 K
  • New Property sales were 14.58% by value where as Not New Property contributed 81.9%


City Of Peterborough has unitary authority area status in East of England.

Total Sales By Property Type

City Of Peterborough - Total Sales By Property Type

City Of Peterborough had total property sales of  £801 millions which was 2.32% of East of England property market 2015.

The split across the different property types are:

  • Terraced at £149 millions (18.61%)
  • Semi-Detached at £150 millions (18.78%)
  • Other at £218 millions (27.17%)
  • Flat/Maisonette at £39 millions (4.81%)
  • Detached at £245 millions(30.62%).


Total No Of Properties Sold By Property Type

City Of Peterborough - Total No Of Properties Sold By Property Type

The total property sales of £801 millions in 2015 was spread over 3,487 properties.

  • Terraced properties at 1,128 (32.35%)
  • Detached at 962 (27.59%)
  • Semi-Detached at 923 (26.47%)
  • Flat/Maisonette at 405 (11.61%)
  • Others 69 (1.98%). 


Average & Median Sales Price

City Of Peterborough - Average & Median Sales Price

The average sales price in City Of Peterborough was £230 K.For the different property types it was:

  • Detached £255 K
  • Semi-Detached £163 K
  • Terraced £132 K
  • Flat/Maisonette £95 K
  • Other it is £3.15 millions.

Similarly median sales price in City Of Peterborough was £150 K.For the different property types are:

  • Detached £223 K
  • Semi-Detached £158 K
  • Terraced £125 K
  • Flat/Maisonette £94 K
  • Other it is £350 k.


New Vs Not New Property Statistics

City Of Peterborough - New Vs Not New Property Statistics

By Sales Values the split is as follows:

  • New Property was £117 millions (14.58%)
  • Not New Property contributed £684 millions (85.42%).

By Total Number the split is as follows:

  • New properties sold were 631 (18.1%)
  • Not new property sold were 2856 (81.9%).


All East of England Posts