For 2016 details - East of England Property Market 2016
Story Highlights
- East of England had total property sales of £34 billions in 2015.
- The total number of properties sold in 2015 was 116,856 properties
- The total value of sales was maximum for Hertfordshire at £8.85 Billions
- The average sales price in East of England was £295 K whereas median was £235 K
- The maximum average sales at county level was for Hertfordshire at £411 K
- New Property contributed 10.11% where as Not New Property contributed 89.89 % by value
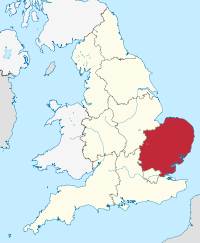
East of England is one of the 9 principal areas of England.
It consists of the counties: Thurrock, Southend-on-Sea, Essex , Hertfordshire, Luton, Bedford, Central Bedfordshire, Cambridgeshire, City Of Peterborough, Norfolk and Suffolk. Essex has the highest population in the region.
Total Value of Sales By Property Types
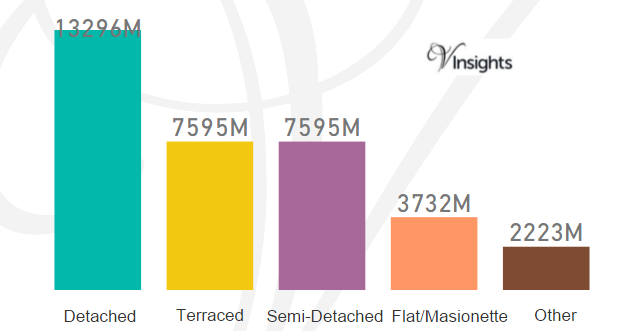
East of England had total property sales of £34 billions.
It contributed 11.67% of the England Wales Property Market 2015.
The split across the different property types are
- Detached at £13.296 billions (38.61%)
- Terraced at £7.6 billions (22.05%)
- Semi-Detached at £7.6 billions (22.05 %)
- Flat/Masionette at £3.73 billions (10.84%)
- Other at £2.22 billions (6.45%).
Total Sales By County
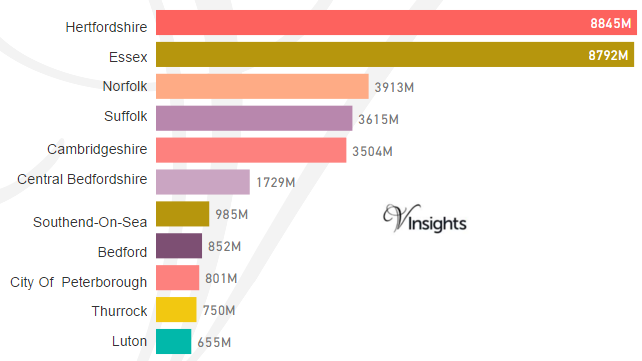
The total sales of £34 Billions in 2015 was split across its counties as above.
Total Number of Sales By Property Types
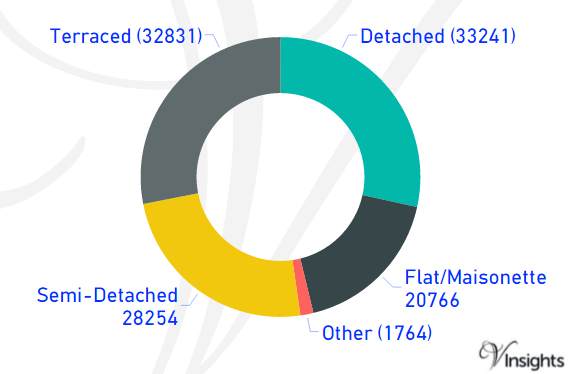
The total property sales of £34 Billions in 2015 was spread over 116,856 properties.
- Terraced properties was 32,831 (28.1%)
- Detached 33,241 (28.45%)
- Semi-Detached 28,254 ( 24.18%),
- Flat/Maisonette 20,766 (17.77%)
- Others 1,764 (1.51%)
Average & Median Sales Price
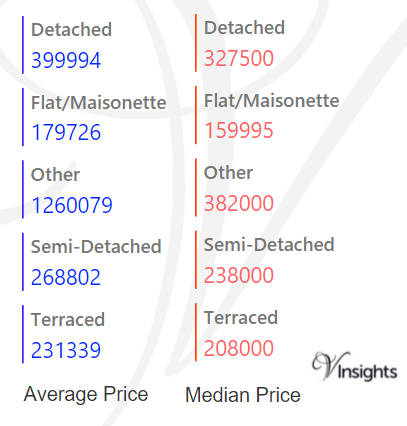
The average sales price in East of England was £295 K. For the different property types it was
- Detached at £400 K,
- Semi-Detached at £269 K,
- Terraced at £231 K,
- Flat/Maisonette at £180 K
- Other it is at £1.26 millions.
Median sales price in East of England was £235 K. For different property types it was
- Detached at £328 K,
- Semi-Detached at £238 K,
- Terraced at £208 K,
- Flat/Maisonette at £160 K
- Other it is at £382 K
Average & Median Sales Price By County
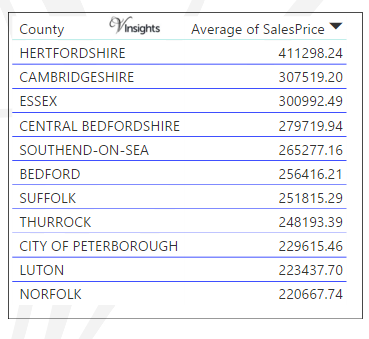
The average of sales price at county level in East Of England in 2015 is as above.
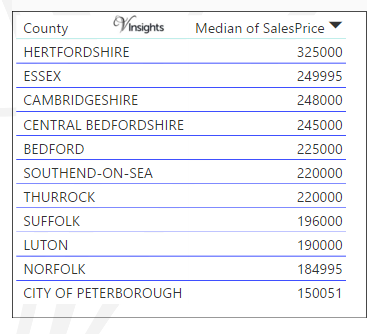
The median of sales price at county level in East Of England in 2015 is as above.
New Vs Not New Property Statistics
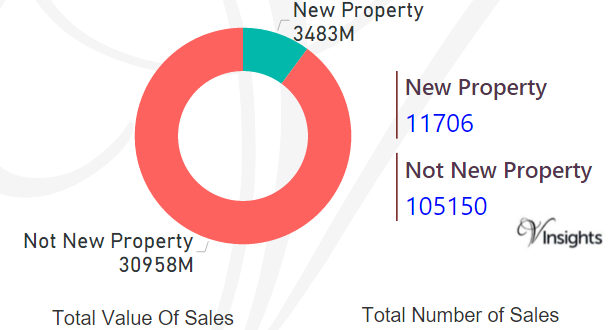
By Value Of Sales
- The sales value contributed by New Property was £3.483 billions (10.11%)
- where as Not New Property contributed £30.96 billions (89.89 %).
By Number Of Sales
- New properties sold were 11,706 (10.02%)
- where as not new property sold were 105,150 (89.98%).
All England Posts

b7d1713c-3222-44a3-8b72-ebf15a52f484|0|.0|27604f05-86ad-47ef-9e05-950bb762570c