Story Highlights
- City of London in 2016 had total property sales of £1.22 billions
- The total number of property sold in City of London 2016 was 216
- The average sales price in City of London was £5.63 millions and the median sales price was £843 K
- The sales value contributed by New Property was 0.77% where as Not New Property contributed 99.23%
- Stamp duty hike caused monthly spike in March
- Brexit coupled with Stamp Duty Hike caused decline in total sales by 6.15%
Total Sales By Property Type
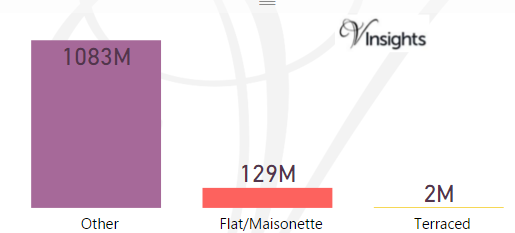
City of London is one of the Boroughs of Central London. It had total Property Sales of £1.22 billions which was 4.92% of Central London Property Market 2016
The split across the different property types are:
- Terraced £2 millions
- Other £1.083 billions (89.17%)
- Flat/Maisonette £291 millions (10.65%)
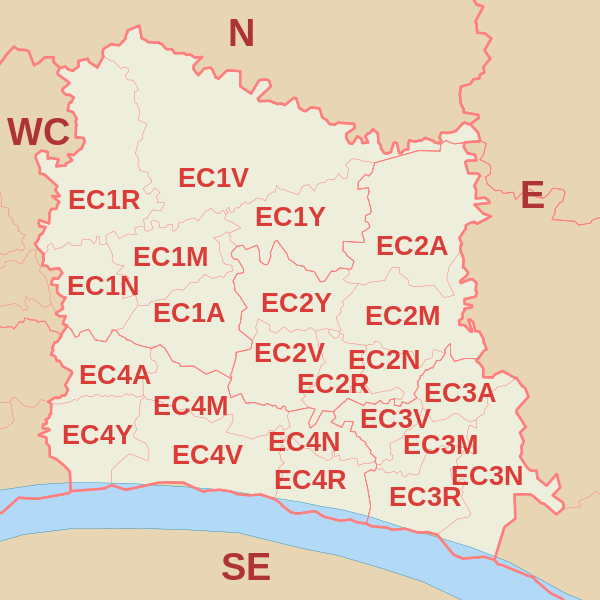
City Of London Property Market at Postcode level
|
|
| Postcode |
Coverage Area
|
Local Authority Area |
| E1 |
Eastern head district: Aldgate (part), Bishopsgate (part), Whitechapel, Shoreditch (part), Spitalfields, Shadwell, Stepney, Globe Town (part), Mile End (part), Portsoken, Brick Lane |
Tower Hamlets, Hackney, City of London |
| EC1A |
St Bartholomew's Hospital |
City Of London, Islington |
| EC1M |
Clerkenwell, Farringdon |
Islington, Camden, City of London |
| EC1N |
Hatton Garden |
Camden, City of London |
| EC1Y |
St Luke's, Bunhill Fields |
Islington, City of London |
| EC2A |
Shoreditch |
Islington, Hackney, City of London |
| EC2M |
Broadgate, Liverpool Street |
Tower Hamlets, City of London |
| EC2N |
Old Broad Street, Tower 42 |
City Of London |
| EC2R |
Bank of England |
City Of London |
| EC2V |
Guildhall |
City Of London |
| EC2Y |
Barbican |
City Of London |
| EC3A |
St Mary Axe, Aldgate |
City Of London |
| EC3M |
Lloyd's of London, Fenchurch Street |
City Of London |
| EC3N |
Tower Hill, Tower of London |
City Of London |
| EC3R |
Monument, Billingsgate |
City Of London |
| EC3V |
Cornhill, Gracechurch Street, Lombard Street |
City Of London |
| EC4A |
Fetter Lane |
City Of London, Westminster |
| EC4M |
St Paul's |
City Of London |
| EC4N |
Mansion House |
City Of London |
| EC4R |
Cannon Street |
City Of London |
| EC4V |
Blackfriars |
City Of London |
| EC4Y |
Temple |
City Of London |
| SE1 |
Bankside, South Bank, Lambeth (part), Southwark, Bermondsey (part), Vauxhall (part), Old Kent Road (part) |
Lambeth, Southwark, City of London |
| WC1V |
High Holborn |
Camden, City of London |
For property market details at post code level please click on Postcode in the table above.
Month-wise Break-up of Total Sales
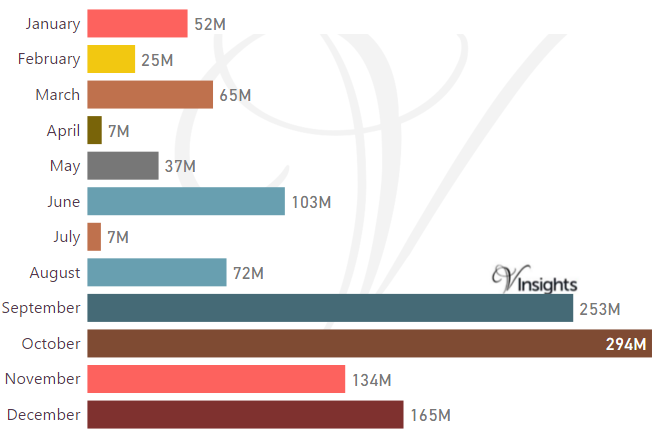
Some of the insights based on the £1.22 billions month-wise break-down :
Stamp Duty Hike Impact
- March had property sale spike of £65 millions compared to £25 millions in Feb
- The impetus for it was to avoid the extra 3% in Stamp Duty Tax applicable on buying an additional home, being applicable from April 1 2016
Brexit Impact
- Brexit took place on 23rd June 2016.
- As can be observed from the month-wise break-up a clear conclusions cannot be drawn on the City of London property market 2016
- Year on Year the property market for City of London has shown a decline of 6.15% over 2015
Total No Of Properties Sold By Property Type
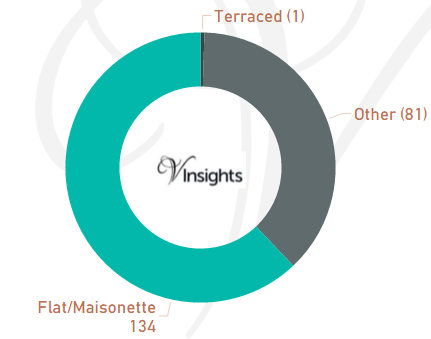
In City of London the total number of properties sold in year 2015 was 216. The breakdown by different property types are:
- Terraced 1 (0.46%)
- Other 81 (37.5%)
- Flat/Maisonette 134 (62.04%)
Year on Year Comparison : Compared to City of London Property Market 2015 in 2016
- Total sales volume has declined by 169 i.e. decline of 43.89%
- All the property type had lower sales volume compared to 2015 except for Others
- Other has shown a growth of 15.71%
Average & Median Sales Price
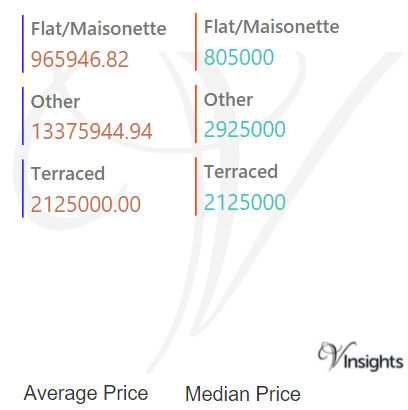
In 2015 the Average property price was £5.63 millions in City of London. The average price for the different property types:
- Flat/Maisonette £966 K
- Other £13.4 millions
- Terraced £2.125 millions
The Median Price was £843 K. The median property price for the different property types are:
- Flat/Maisonette £805 K
- Other £2.93 millions
- Terraced £2.125 millions
Year on Year Comparison : Compared to City of London Property Market 2015 in 2016
- Flat/Maisonette, Terraced properties had increase in average and median price
New Vs Not New Property Statistics
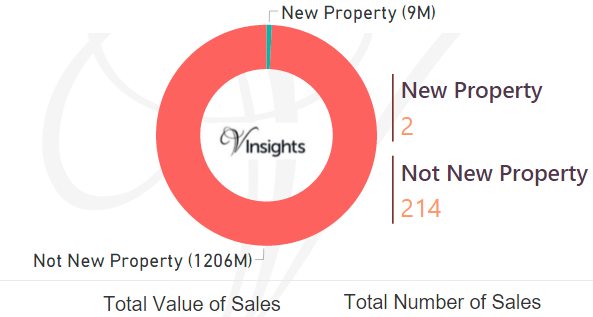
By Value Of Sales
- Not New Property contributed £1.21 billion (99.23%)
- New Property 9 millions (0.77%)
By Number Of Sales
- The number of Not New Property sold was 291 (99.07%)
- The number of New Property sold was 2 (0.93%)
All London Posts
5c5f3f9a-64b0-490c-94eb-bb74cfbecbc9|0|.0|27604f05-86ad-47ef-9e05-950bb762570c