Story Highlights
- Brent had total Property Sales of £1.91 billions in 2016
- The total number of properties sold in year 2016 was 3,300
- The average property price was £580 K in Brent, while median was £445 K
- Not New Property contributed 80.93% and New Property 19.07% by sales value
- Stamp duty changes caused monthly spike in March
- Brexit coupled with Stamp Duty Hike stagnates the property market and total property sales stagnates
Brent is one of the Boroughs of West London. It had total Property Sales of £1.91 billions which was 13.62% of West London Property Market 2016.
Total Sales By Property Type
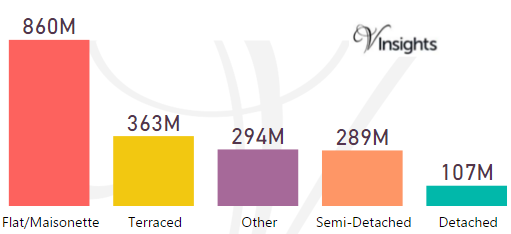
The split of £1.91 billions across the different property types are:
- Flat/Maisonette: £860 millions (44.95%)
- Terraced: £363 millions (18.98%)
- Other: £294 millions (15.38%)
- Semi-Detached: £289 millions (15.11%)
- Detached: £107 millions (5.59%).
Year on Year Comparison : Compared to Brent Property Market 2015 in 2016
- Flat/Maisonette, Other have shown growth in property sales by value
- Terraced, Semi-Detached, Detached have shown decline in property sales by value
- Property sales has remained fairly constant over 2015
Brent Property Market at Postcode Level
| Postcode |
Coverage Area
|
Local Authority Area |
| EC1V |
Finsbury (east), Moorfields Eye Hospital
|
Islington, Hackney, Brent |
| HA0 |
Alperton, Sudbury, Sudbury Hill, Wembley Central and North Wembley
|
Brent, Harrow, Ealing |
| HA1 |
Harrow, Harrow on the Hill, North Harrow, Northwick Park, Sudbury, Sudbury Hill
|
Harrow, Brent |
| HA3 |
Harrow Weald, Kenton, Wealdstone, Queensbury, Belmont (part)
|
Harrow, Brent |
| HA8 |
Edgware, Burnt Oak, Canons Park, Queensbury
|
Barnet, Brent, Harrow |
| HA9 |
Wembley, Wembley Park, Wembley Central (East), Preston, Tokyngton
|
Brent |
| NW2 |
Cricklewood district: Cricklewood, Dollis Hill, Childs Hill, Golders Green (part), Brent Cross (part), Willesden (north), Neasden (north)
|
Barnet, Brent, Camden |
| NW6 |
Kilburn district: Kilburn, Brondesbury, West Hampstead, Queen's Park, Kensal Green (part), South Hampstead (south), Swiss Cottage (west)
|
Brent, Camden, Westminster |
| NW9 |
The Hyde district: The Hyde, Colindale, Kingsbury, West Hendon, Queensbury (part)
|
Barnet, Brent, Harrow |
| NW10 |
Willesden district: Willesden, Harlesden, Kensal Green, Brent Park, College Park, Stonebridge, North Acton (part), West Twyford, Neasden (south), Old Oak Common, Park Royal (north)
|
Brent, Ealing, Hammersmith and Fulham, Kensington and Chelsea |
| W9 |
Maida Hill, Maida Vale, Little Venice (part)
|
Westminster, Brent, Camden |
| W10 |
North Kensington, Kensal Town, Ladbroke Grove (north), Queen's Park (part)
|
Kensington and Chelsea, Westminster, Hammersmith and Fulham, Brent |
For property market details at post code level please click on Postcode in the table above.
Month-wise Break-up of Total Sales
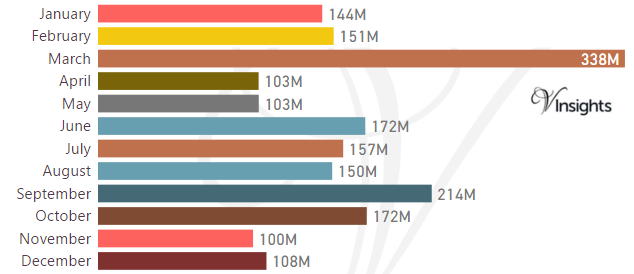
Stamp Duty Hike Impact
- March had property sale spike of £338 millions compared to £151 millions in Feb
- The impetus for it was to avoid the extra 3% in Stamp Duty Tax applicable on buying an additional home, being applicable from April 1 2016
Brexit Impact
- Brexit took place on 23rd June 2016.
- As can be observed from the month-wise break-up there does not seem to have been dip in property sales in the immediate aftermath of Brexit
- Year on Year the property market for Brent has remained fairly constant
Total No Of Properties Sold By Property Type
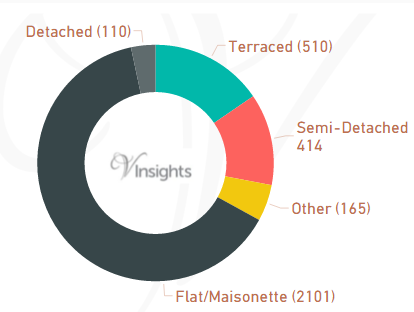
In Brent the total number of properties sold in year 2016 was 3300
The breakdown by different property types are:
- Terraced: 510 (15.45%)
- Semi-Detached: 414 (12.55%)
- Other: 165 (5%)
- Flat/Maisonette: 2,101 (63.67%)
- Detached: 110 (3.33%).
Year on Year Comparison : Compared to Brent Property Market 2015 in 2016
- Total number of property sales in Brent has declined by 6.33%
- All property types have shown decline in number of properties sold except property type Other
- Other has shown significant growth by 87.5% over 2015 in terms of number of properties sold
Average & Median Sales Price
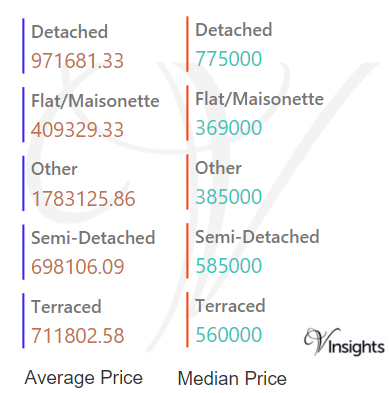
In 2016 the Average property price was £580 K in Brent. The average property price for the different property types are:
- Detached: £972 K
- Flat/Maisonette: £409 K
- Other: £1.78 millions
- Semi-Detached: £698 K
- Terraced: £712 K.
The Median property price was £445 K. The median property price for the different property types are:
- Detached: £775 K
- Flat/Maisonette: £369 K
- Other: £385 K
- Semi-Detached: £585 K
- Terraced: £560 K
Year on Year Comparison : Compared to Brent Property Market 2015 in 2016
- The average and median sales price across all property types have gone up except for Detached, Other
New Vs Not New Property Statistics
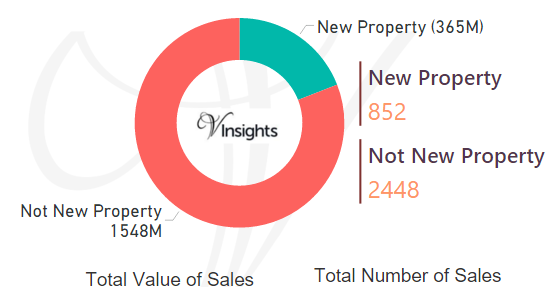
By Value Of Sales
- Not New Property Contributed £1.55 billion (80.93%)
- New Property £365 millions (19.07%)
By Number Of Sales
- The number of Not New Property sold was 2,448 (74.18%)
- whereas the number of New Property sold was 852 (25.82%)
Year on Year Comparison : Compared to Brent Property Market 2015 in 2016
- New property market share in property market has gone up in 2016 over 2015
All London Posts
88ff134c-92d8-411f-8f2f-2756a74e1436|0|.0|27604f05-86ad-47ef-9e05-950bb762570c