Story Highlights
- Merton had total Property Sales of £1.74 billions in 2016
- The total number of properties sold in year 2016 was 2859
- The Average property price was £609 K in while median was £443 K
- Not New Property Contributed 96.23% and New Property 3.77% by sales value
- Stamp duty changes caused monthly spike in March
- Brexit coupled with Stamp Duty contribute to the 9.4% decline in total sales value
Merton is one of the Boroughs of South London. It had total Property Sales of £1.74 billions which was 12.22% of the South London Property Market 2016
Total Sales By Property Type
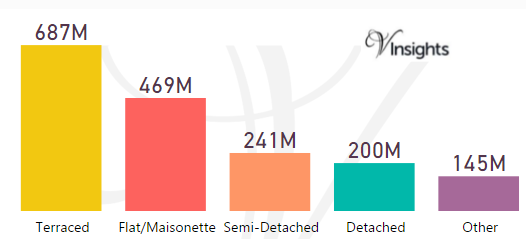
The split of £1.74 billions across the different property types are:
- Terraced £687 millions (39.44%)
- Flat/Maisonette £469 millions (26.9%)
- Semi-Detached £241 millions (13.86%)
- Detached £200 millions (11.46%)
- Other £145 millions (8.33%)
Year on Year Comparison : Compared to Merton Property Market 2015 in 2016
- All the property types have shown in sales except others.
- Others has shown growth of 2.84% in total sales value
Merton Property Market at Postcode Level
| Postcode |
Coverage Area
|
Local Authority Area |
| CR4 |
Mitcham, Mitcham Common, Pollards Hill, Eastfields, Beddington Corner
|
Merton, Sutton, Croydon |
| CR7 |
Thornton Heath, Broad Green (part)
|
Croydon, Merton |
| KT3 |
Croydon, Merton
|
Kingston Upon Thames, Merton |
| SM3 |
The western part of Sutton Common, North Cheam, Stonecot Hill
|
Sutton, Merton |
| SM4 |
Morden, Morden Park, Lower Morden, St. Helier (West), Rosehill
|
Merton, Sutton |
| SW14 |
Mortlake, East Sheen
|
Richmond Upon Thames, Merton |
| SW15 |
Kingston Vale, Putney, Putney Heath, Putney Vale, Richmond Park, Roehampton, Roehampton Vale
|
Kingston Upon Thames, Richmond Upon Thames, Wandsworth, Merton |
| SW16 |
Streatham, Streatham Common, Norbury, Thornton Heath, Streatham Park, Furzedown, Streatham Vale, Mitcham Common, Pollards Hill, Eastfields
|
Croydon, Lambeth, Merton, Wandsworth |
| SW17 |
Tooting, Mitcham (part) Balham (part)
|
Merton, Wandsworth |
| SW18 |
Wandsworth, Southfields, Earlsfield
|
Wandsworth, Merton |
| SW19 |
Wimbledon, Colliers Wood, Merton Park, Merton Abbey, Southfields, Morden (part)
|
Merton, Wandsworth |
| SW20 |
Raynes Park, Lower Morden, Merton Park, Wimbledon Chase
|
Merton, Kingston upon Thames |
For property market details at post code level please click on Postcode in the table above.
Month-wise Break-up of Total Sales
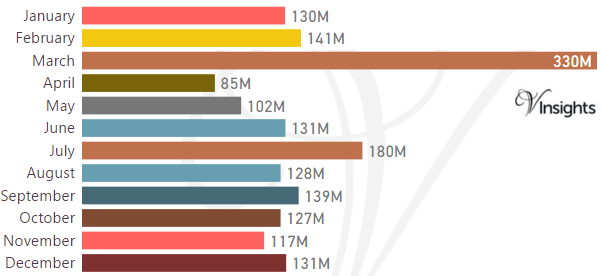
Stamp Duty Hike Impact
- March had property sale spike of £330 millions compared to £141 millions in Feb
- The impetus for it was to avoid the extra 3% in Stamp Duty Tax applicable on buying an additional home, being applicable from April 1 2016
Brexit Impact
- Brexit took place on 23rd June 2016.
- As can be observed from the month-wise break-up there does not seem to have been significant dip in property sales in the immediate aftermath of Brexit
- Year on Year the property market for Merton has shown a decline of 9.4% over 2015
Total No Of Properties Sold By Property Type
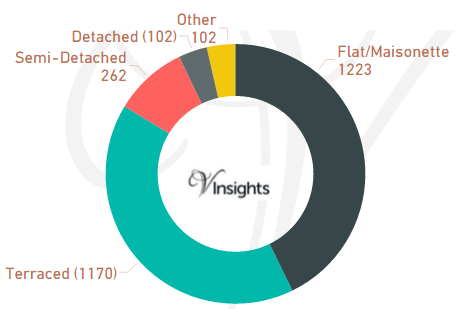
In Merton the total number of properties sold in year 2016 was 2859
The breakdown by different property types are:
- Terraced 1170 (40.92%)
- Semi-Detached 262 (9.16%)
- Other 102 (3.57%)
- Flat/Maisonette 1223 (42.78%)
- Detached 102 (3.57%)
Year on Year Comparison : Compared to Merton Property Market 2015 in 2016
- Total number of property sales in Merton has declined by 11.89%
- All property types have shown decline in number of properties sold except property type Other
- Other has shown significant increase of 24.4%
Average & Median Sales Price
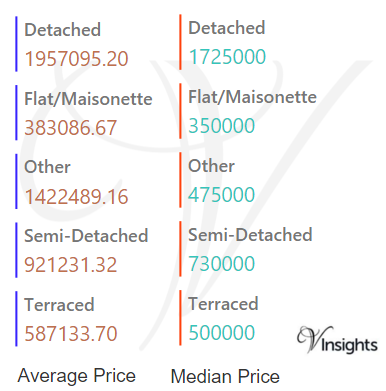
The average sales price in Merton was £609 K. For the different property types it was:
- Detached £1.96 millions
- Semi-Detached £921 K
- Terraced £587 K
- Flat/Maisonette £383 K
- Other it is £1.4 millions.
Similarly the median sales price in Merton was £443 K. For the different property types it was:
- Detached £1.73 millions
- Semi-Detached £730 K
- Terraced £500 K
- Flat/Maisonette £350 K
- Other it is £475 K
Year on Year Comparison : Compared to Merton Property Market 2015 in 2016
- Fpr Flat/Maisonette, Semi-Detached, Terraced the average and median sales price have gone up
- Others have shown sharp decline in average and median sales price
New Vs Not New Property Statistics
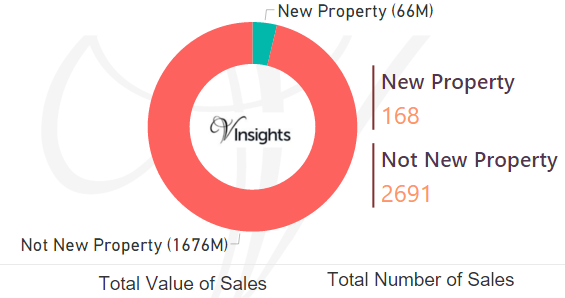
By Value Of Sales
- Not New Property contributed £1.7 billions (96.23%)
- New Property £66 millions (3.77%)
By Number Of Sales
- The number of Not New Property sold was 2691 (94.12%)
- The number of New Properties sold was 168 (5.88%)
Year on Year Comparison : Compared to Merton Property Market 2015 in 2016
- New property market share in property market has not shown noticeable difference in 2016 over 2015
All London Posts
2d4f3d7e-e2af-46b2-a7be-3aa0c050233a|0|.0|27604f05-86ad-47ef-9e05-950bb762570c